ELS Calculator

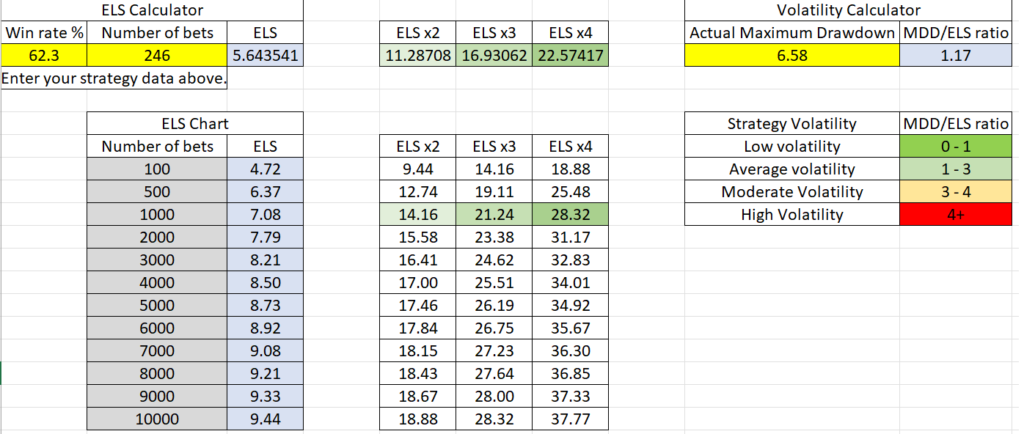
E.L.S. = Estimated Losing Sequence

We can use the win rate of a strategy to calculate its expected longest losing sequence. This is the number of consecutive losing bets in a row. In a long losing streak, we can expect 2 or 3 of these ELSs to come within a short space of time. 

We can take this ELS figure and multiple it by x4 to get an expected maximum drawdown, and from that figure we can calculate a conservative betting bank figure (bankroll) needed for this strategy.

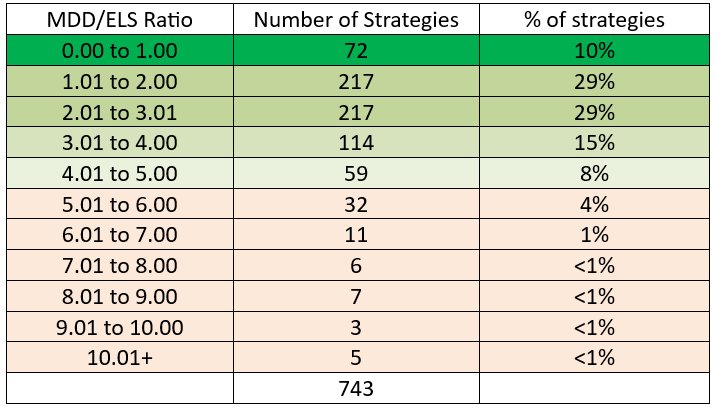
Download the Excel file and enter your data in the yellow cells. If you have the actual maximum drawdown figure, then you can get an idea of how volatile this strategy is compared to other strategies. I use a MDD/ELS ratio for this. 

Is a drawdown of the ELS x2 or x4 normal?

The only way we can gauge these things is through comparison of data.

There are 743 Public Strategies on Betaminic at the moment (2024-4-8). I did an analysis of their Maximum Drawdown to ELS ratio.

I would say a drawdown which is the ELS x1-4 could be considered normal. Over x4 is unusually volatile.

I think the MDD/ELS ratio is a good new indicator of how volatile a system is in comparison to others because it takes into account bet numbers and win rates. In this way we can compare high win rate strategies with low win rate ones, and we can compare  strategies with 10,000 bets worth of data with those that have less than 1,000 bets worth of data.  We can finally find a fair unit of comparison.