One important part of making good betting plans is basing decisions on data.
With the BF Bot Manager, the software gathers and stores a lot of data for us automatically, which makes our life a lot easier.
Each bot tells us how many bets and markets it has been it and its win rate in them. We can see the profit and loss, and we can also see the individual bets in the bet history.
But as we use BFBM longer, and add in more bots, it can get harder to remember the monthly performance and characteristics of each bot.
We may also start to edit and duplicate bots, ending up with a very large bot set with similar results and we are not sure which bot is the best version to focus on.
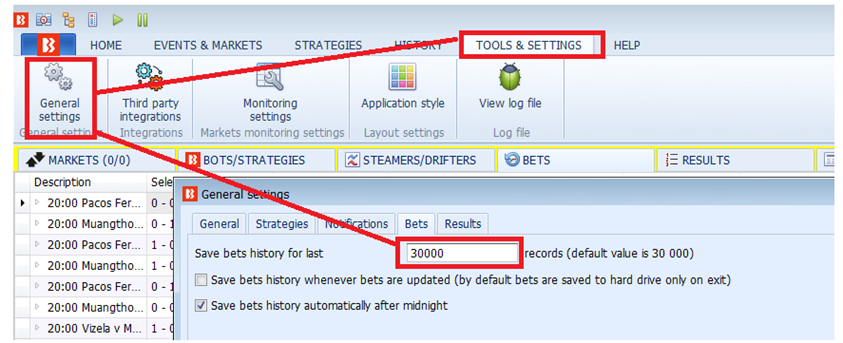
If you are using high bet volume bots, then you may also reach the 30,000 bets default limit of the bet history and older bet details get lost as the oldest data gets overwritten.
This means that we need to find a way to log bot results in a way that works best for us.
There are three main ways that I log bot results:
1. Bot Screenshots (+ Word Document)
2. Bot Snapshots (+ Excel Spreadsheet)
3. Bet History (+ BFBM Autosave program + Excel Spreadsheet + TSM Staking Analysis software)
1. Bot Screenshots (+ Word Document)
This is the simplest way to keep logs.
If you have a bot that you want to track, then take regular screenshots of the bot and paste them into a Word Document.
You can screenshot them daily, weekly or monthly depending on your needs and time available.
I usually screenshot bots monthly. I use those screenshots in my newsletters.
Then I can go back through my screenshots and see the monthly changes in my bots. This is one way to give me a feel for how the bots have performed over time.
If you line up the bot screenshots next to each other, it makes it easier to see the profit change, the number of bets placed and the change in win rate.
How do you take a screenshot?
I usually press “shift + S + windows key”, then the screen dims to dark with a menu at the top.
Then I left click anywhere on the screen which becomes the top left of my “drag and photo” screenshot box area.
I then click paste into a word file and the image I boxed should appear
See this page for more help on “How to take a screenshot”.
2. Bot Snapshots (+ Excel Spreadsheet)
This is my most recommended way of tracking bot results and is how I track my most important bots.
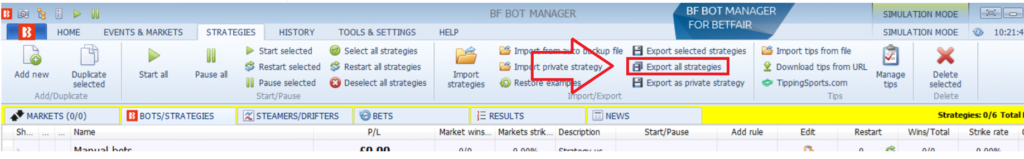
A “Bot Snapshot” is where you “Export all strategies” in your BFBM on a regular basis. I aim to do it monthly, but sometimes also make weekly snapshots.
I then give it a name with a few details like the date & time, which BFBM it is form (if you have multiple BFBMs running) and how many bots are in the set, such as “2026-03-04 2130 BFBM1 backup x45 bots” and store it in a folder.
By saving the bots like this, then I can re-import those bots into another BFBM (for example on another laptop or desktop), and then I can see what the bots looked like on that date.
It means I can preserve all the bot data at that moment without having to use more time logging them or organising the data yet.
If I have lots of bots running, I may not want to waste time logging all data, but with this method, if a new bot emerges as doing very well, then I can go back through my snapshots in order to get screenshots or to note the data, and build up a monthly history of that bot that I had not previously paid attention to. This is the main importance of the snapshot saves. They are there if you need them when you want to check back on a bot you had not logged before.
I have about 5-6 BFBMs running with about 800-900 bots, and it would take too much time to log them each month. But I can make snapshot saves in case I want to focus on one bot in the future and back-check its data.
Once you have the snapshots, then when you have a bot to focus on, you either take screenshots and line them up in a Word document, or you can enter their data in Excel.
I prefer to enter the data in Excel. It makes it easier for me to build up a lot of key data of multiple bots and then compare them to each other.
This is a bit more time consuming, but it really does help you build up a better picture of which bots are the best to focus on with your main betting bank.
How to log them in Excel?
Ther are many ways you can choose to log your data, so it really is up to you.
I will share two of my methods.
1 Overall Monthly Results View in Excel
2 Individual Bot Detailed View in Excel
1 Overall Monthly Results View in Excel
In this method, I log only the monthly profit of a bot or set of bots.
To make things comparative, I try to convert all results to 100-point banks or 1 unit level stakes.
I add highlights to show winning and losing months.
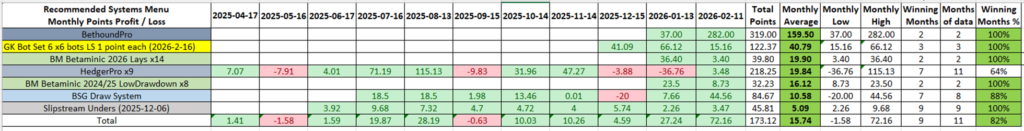
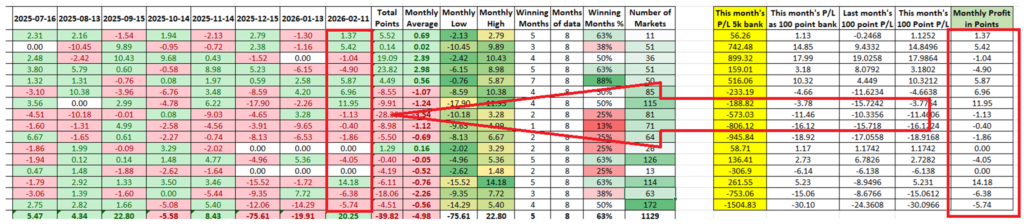
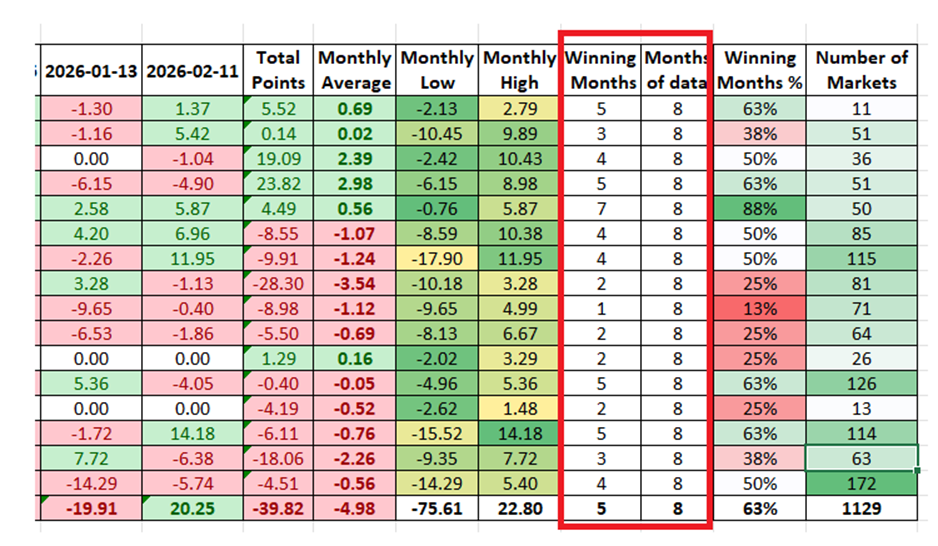
I add extra columns to give me: Total Points, Monthly Average, Monthly Low (biggest loss), Monthly High (biggest profit), Number of Winning Months, Number of Months of Data and the percentage of winning months.
This gives me an “at a glance” view to see how different bots or bot sets perform, including their volatility (highs/lows/averages) and consistency (monthly win rate). One column missing from the examples below is “Number of Markets Settled” to give me an idea of the volume of data that the statistics come from and thus how much evidence there is to support the suggested trends. I will always trust a bot more if it has more data to support its trend.
I can then make an informed choice of which bots to allot more funds to, or which bots to pay more attention to. I can also rank and filter the bots by different factors.
(You can download an example bot tracking file of mine here showing how I log data.)
Data Entry Advice
There is no automated way to do this. It is mostly manual entry. So you have to choose the bots you want to track carefully.
But once you setup an excel file and a method for one bot, it gets easier and smoother to add more bots and track the data.
I usually have extra columns on the far right where I have “last month” and “this month” bot P/L numbers with an automated third column to calculate the difference, which I can then copy and paste into the new column of results for this month. If the bot did not have a 100-point bank then I also add a column to convert its bank to a 100-point bank. It really speeds things up and makes it easier to log things.
My data entry method
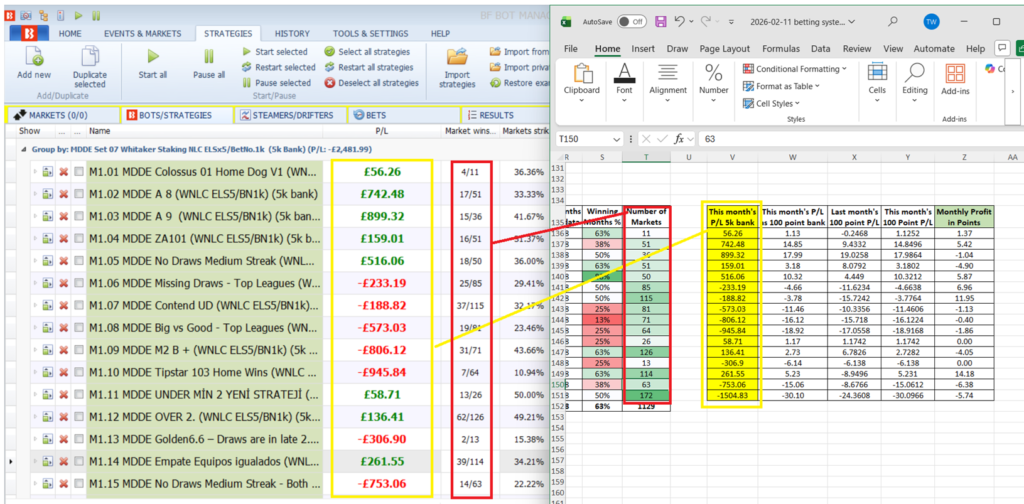
1. First I want to enter this month’s data into my bank converter and auto P\L calculator columns. I hover my half-size Excel file over the BFBM so I can see the bot P/L and market wins columns.
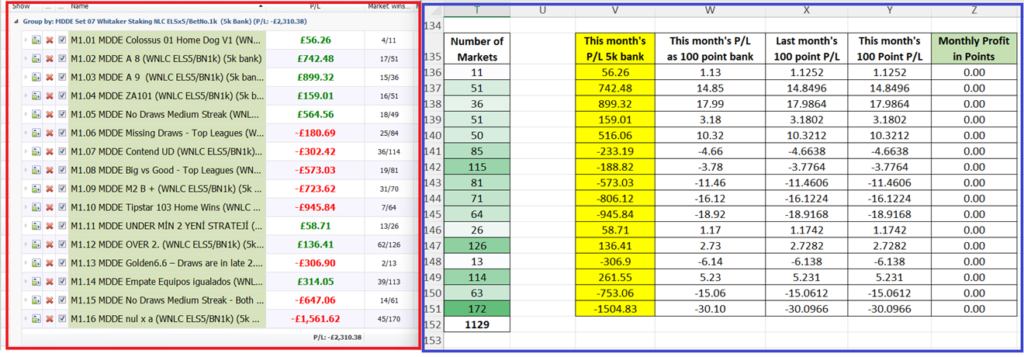
2. The existing data in my Excel file will be from last month (Jan), so I copy my “This month’s 100 Point P/L” column data into “Last month’s 100 point P/L” column.
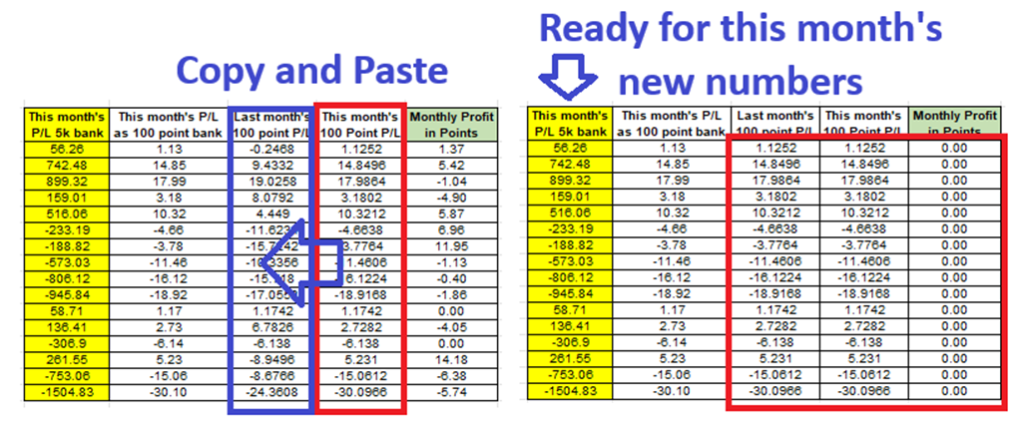
3. I copy out the BFBM P/L numbers into “This Month’s P/L 5k bank” column (Feb). My columns then automatically convert those figures to a 100 point bank, compare them to last month’s results and it gives me this month’s P/L.
4. I also copy out the BFBM Market wins numbers into the “Number of Markets” column.
5. I then copy and paste this month’s “Monthly profit in points” column to the main table’s column of profit for this month’s snapshot date.
6. I manually update the “Winning Months” and “Months of data” columns.
Done. I now have my data updated for these bots.
It takes effort, but you get a great “at a glance” view of the bots you are using and all the key data needed to make a logical decision.
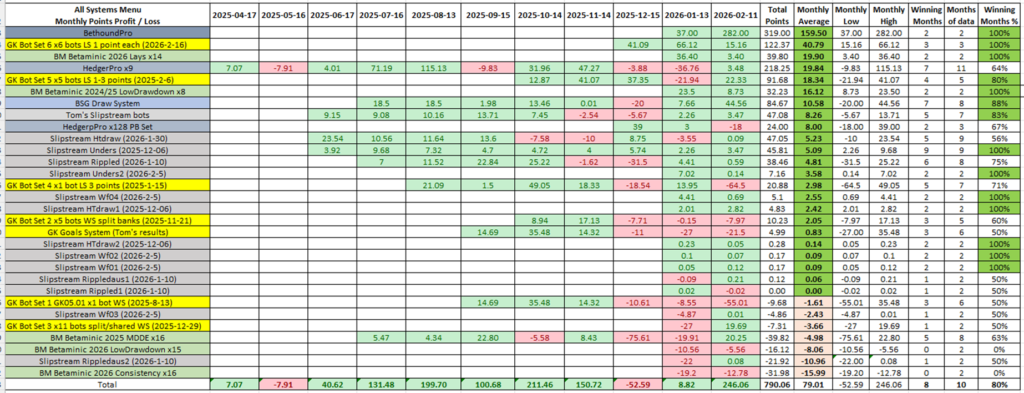
I tend to rank mine by average monthly profit, and then choose the strategies with the most data or highest monthly win rates.
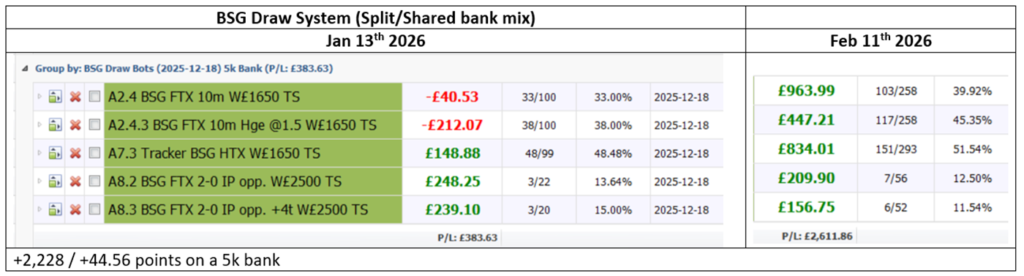
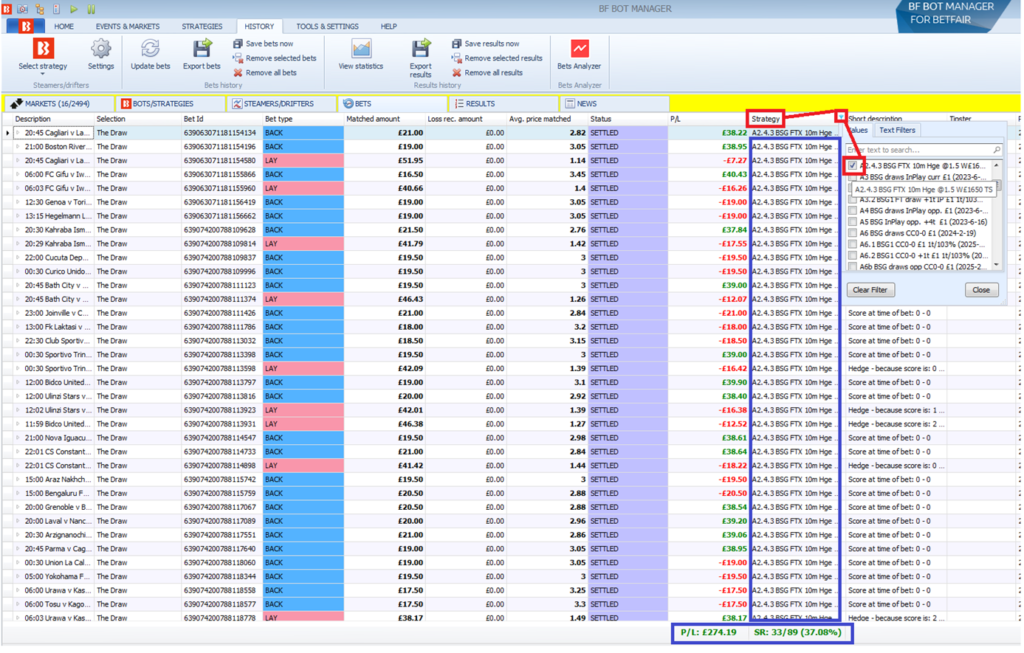
This is how I can see BSG Draw System is a standout winner with 10% monthly profit and 7 out of 8 months in profit and a high of +44% and a low of -20% in that period.
2 Individual Bot Detailed View in Excel
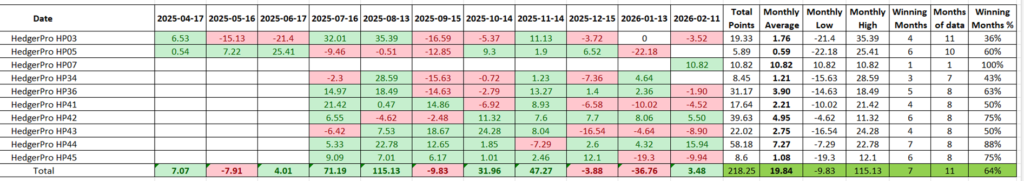
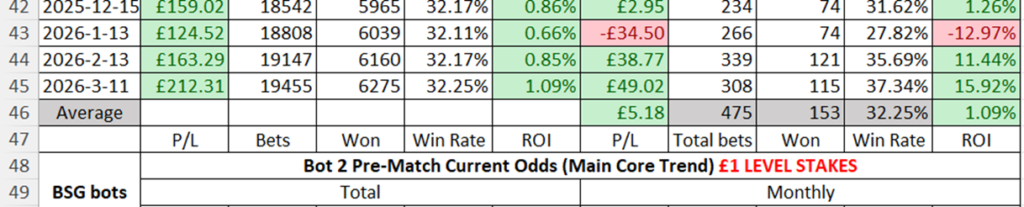
In this method, I try to track a bot more precisely. I want to see the monthly P/L, the monthly bet number, win rate and ROI.
This gives me a better image of the ups and downs of the trend.
I can add columns at the bottom to give me average monthly profit, bet number, win rate and ROI.
(You can download an example bot tracking file of mine here showing how I log data.)
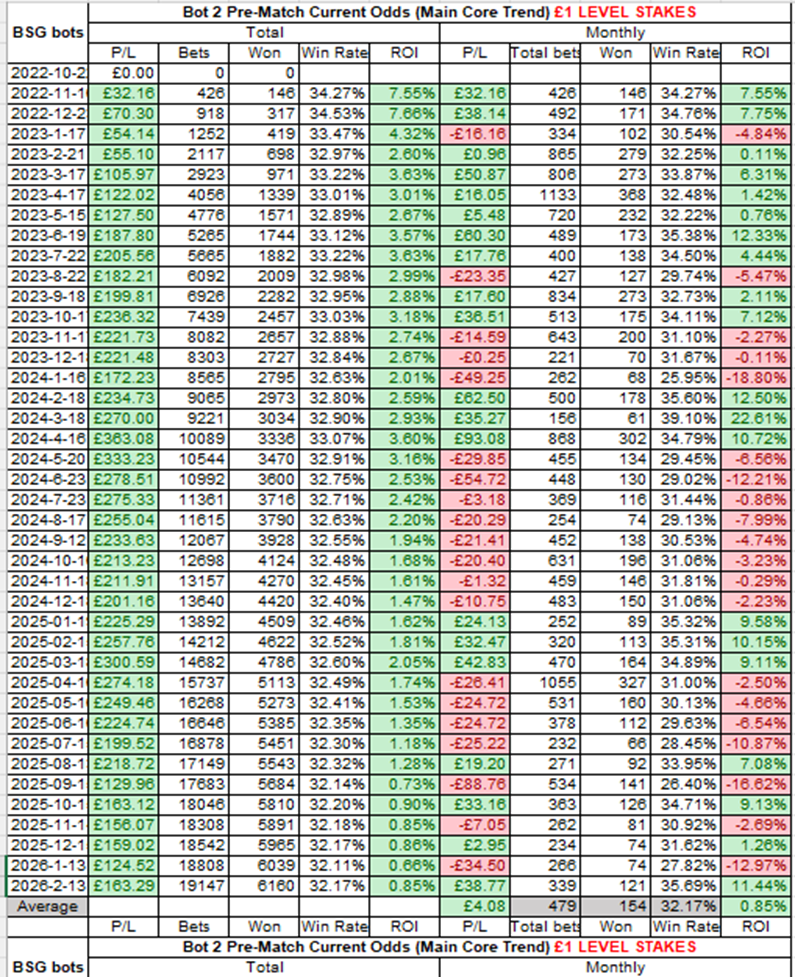
For me, a key factor I look for is when months have similar win rates, but different ROI. That tells me if the markets have changed and the trend has been affected.
If there is a losing month and the win rate was lower, then it is simply negative variance.
But if there is a losing month and the same win rate generated profit in the past, then the market model has changed and the trend may not be the valid anymore.
For example, we see October and December 2024 both has 31.06% win rates but December had a better ROI. This indicates the trend is getting stronger.

Again, in January and February 2025 we see very similar win rates, but February has a better ROI. Again, this indicates the trend is getting stronger.

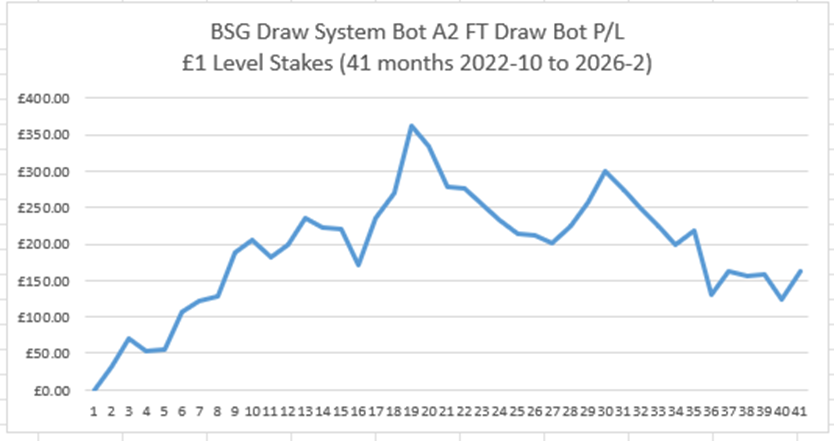
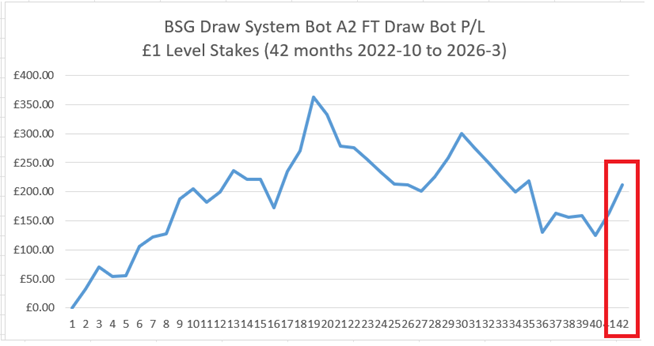
I can also use the monthly profit column to give me an Excel line graph.
This gives me a monthly results graph to get a good idea of how the bot has performed over time.
Data Entry Advice
There is no automated way to do this. It is mostly manual entry. So you have to choose the bots you want to track carefully.
But once you setup an excel file and a method for one bot, it gets easier and smoother to add more bots and track the data.
My data entry method
1. Right-click on the row after last month and select “insert”.
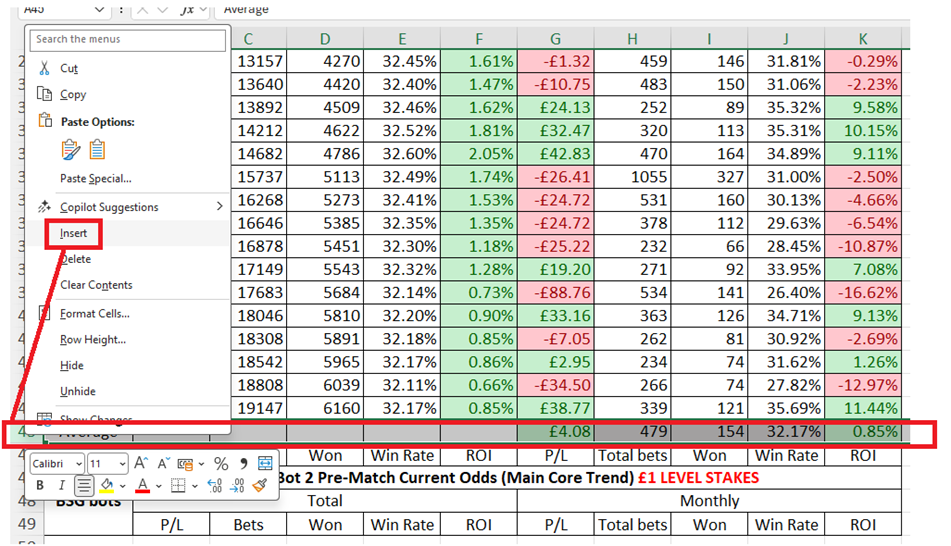
2. Manually enter the date of your data and enter the new data. I just need 3 items: the current P/L, number of markets and market wins.
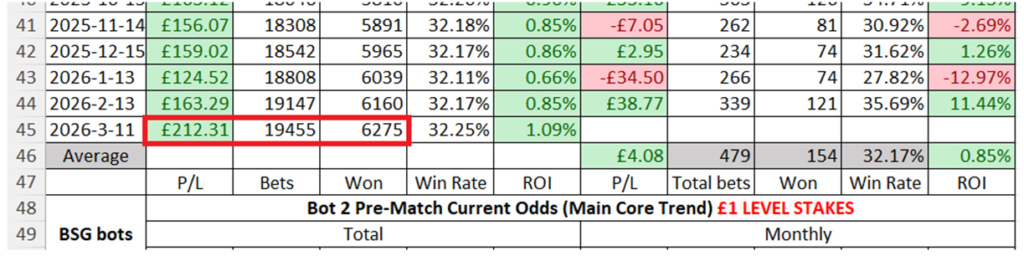
3. Copy the 5 cells above the empty “Monthly” results cells, and paste them into the empty “Monthly” results cells.
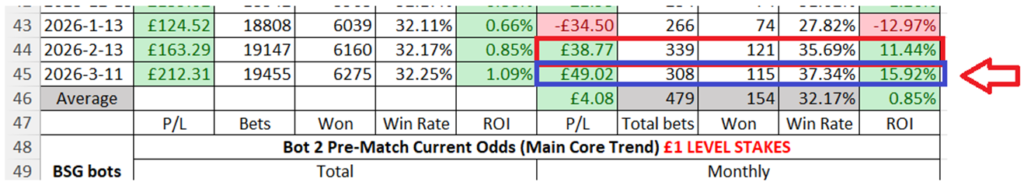
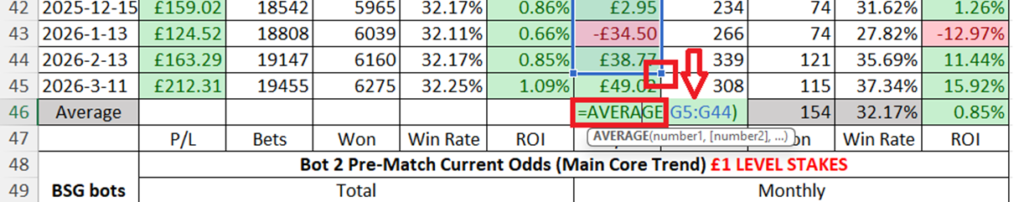
4.The Average row needs it formula updating. Double-click on the P/l Average cell. Then left-click-and-drag the bottom right corner of the above blue boxed area down one cell to include the new monthly data.
Repeat that action with the “Total Bets” cell and “Won” cell. The Win Rate and ROI columns automatically update themselves.
We then have our data nicely updated.
For the chart, you can left-click on the “Values” icon and click “Select Data” and add one to the row number that the graph is based on.
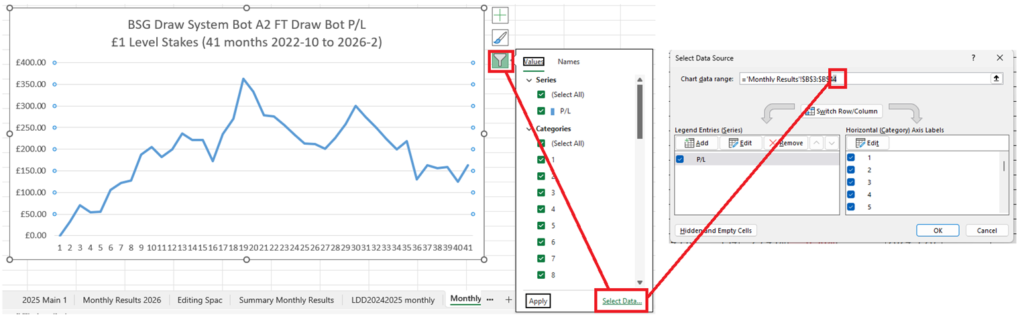
We then have the new month of data added to the chart.
Excel experts might be watching in pain at my clumsy Excel methods, but it gets the job done and works for me.
3. Bet History (+ BFBM Autosave program + Excel Spreadsheet + TSM Staking Analysis software)
Another way you can track bot results is with the BFBM Bet History.
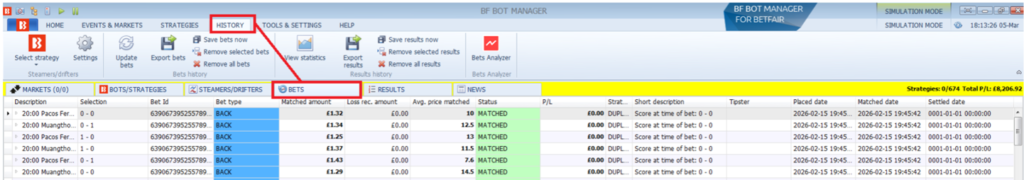
Bf Bot Manager stores the bet history of all bots up to the last 30,000 bets. That is the default setting. You can increase that number, but it might overwork the software.
If you are using only a few bots, then it makes sense to rely on the Bet History.
In the Bet History page, you can find the “Strategy” column and left click on the small filter icon at the top right of the “Strategy” column header cell.
You can then isolate one strategy’s results to view.
The P/L, winning bets, bets placed and strike rate at the bottom of the bet history is then just for the selected strategy.
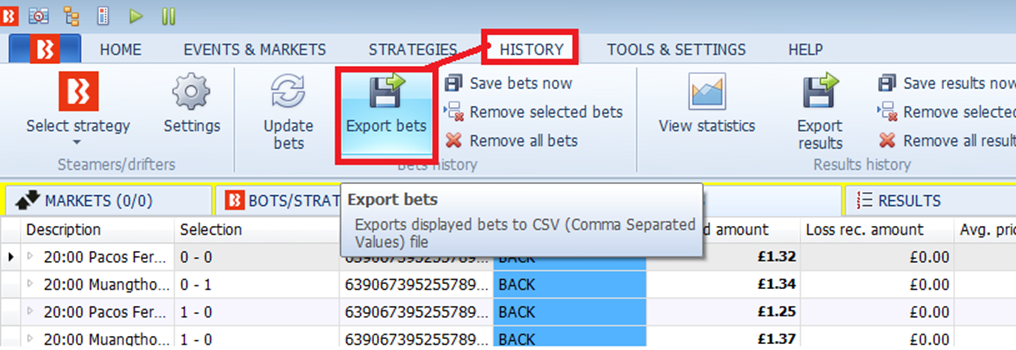
You can also export the bet history and manipulate it in excel.
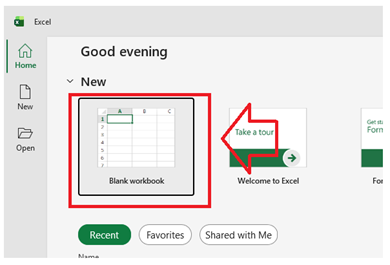
IMPORTANT: After exporting the bet history file. DO NOT just open it directly. You must open a new, empty excel file, and then IMPORT the BFBM bet history data into the Excel file in order for the data to processed properly.
Importing a BFBM Bet History file into Excel
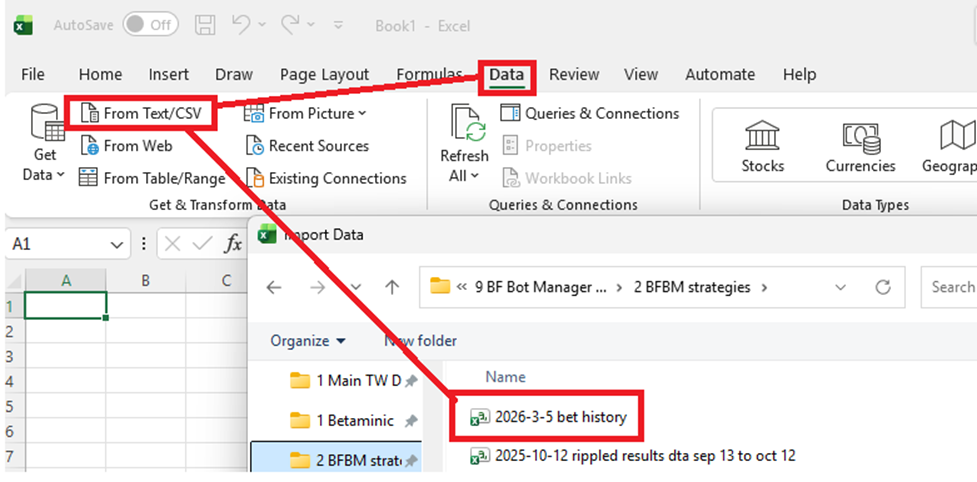
1. Open a new blank workbook.
2. Go to the “Data” tab and click “From Text/CSV” and then find and select the bet history file you just exported.
3. If the data looks okay, then click “Load”. If the data, especially the P/L column looks strange and is not being recognised as numbers, then change the “File Origin” setting until it recognises the P/L column as numbers.
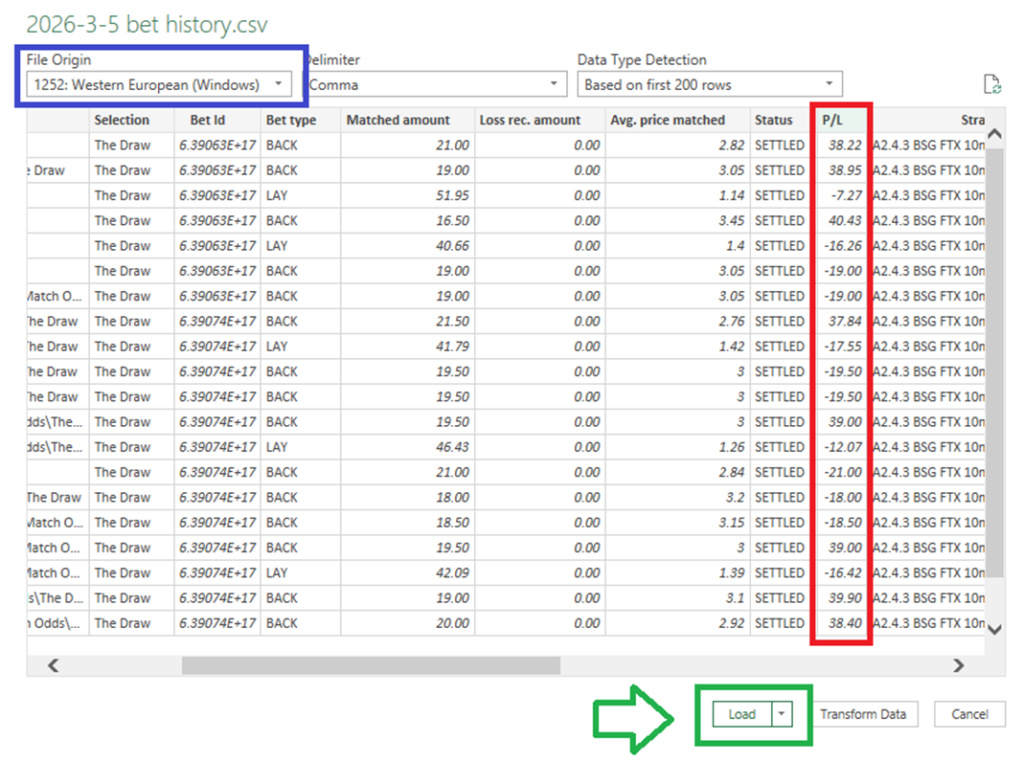
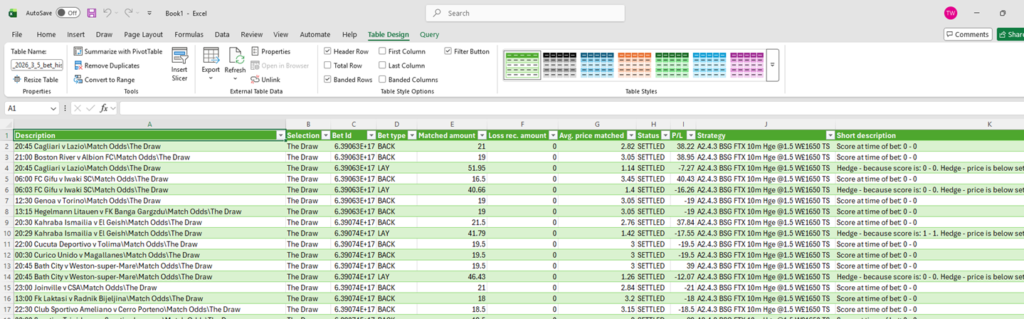
The data will then be loaded, and you can store or manipulate that data.
If you selected specific strategies in BFBM when you exported bet data, then only that data will be exported.
If you didn’t select and strategies, then data for ALL strategies will be exported. In that case, you cans till select and isolate a strategy in Excel by using the “Strategy” column.
If you are using high bet volume bots, then you may reach the 30,000 bets default limit of the bet history and older bet details get lost as the oldest data gets overwritten.
There are two solutions to the 30,000 bet history limit.
1. Regularly export Bet History each month, or each week.
2. Use the BFBM Bet History Autosave program developed by a veteran BFBM user.
1. Regularly export Bet History each month, or each week.
This is fine and can work. But one problem I have is that I end up with multiple Bet History files. Each with overlapping time periods and duplicate bets. If I want to analyse one strategy, then I need to find and piece together that strategy from multiple Bet History files. Again, if you only have one or two bet history files, then this can be done. But if you have many bet history files, then it becomes time consuming and frustrating.
2. Use the BFBM Bet History Autosave program developed by a veteran BFBM user.
With this option, the Autosave program checks the BFBM bet history file each day for new bets and exports only the new bets to a master bet history file. I then only need to use that one master autosave file when I want to analyse a particular strategy. This does mean I can end up with a very large file with 100,000+ entries, but at least all my data is in one place.
I can then work with the data in the Bet History file to get what I need.
One more advantage of the Bet History data is that it logs every bet and its odds.
If I manipulate this data, I can then import that data into staking software like The Staking Machine (TSM) where I can analyse the strategy performance in even more detail and run staking tests.
This video shows how to prepare excel data for importing into TSM.