Pinnacle Automation of backtested, multi-sport strategies is now possible.



B2I has released their own “B2I Strategy Builder”.
This is a multi-sport database that can be used to backtest betting ideas for EIGHT sports: Tennis, Baseball, American Football, Soccer, Hockey, Basketball, E-Sports and Volleyball. Those strategies can then be automated through the B2I site to bet on official Pinnacle* accounts.
(*Unfortunately, it only works with official Pinnacle.com accounts and not the white-label PS3838 accounts that betting agents can provide us.)

Eight sports included in the B2I Strategy Builder
| American Football | Baseball | Basketball | E-Sports |
| Hockey | Soccer | Tennis | Volleyball |
This is a great chance to diversify your betting strategies into sports not yet in your multi-strategy system.
Markets + Competitions Included
| American Football | Baseball | Basketball | E-Sports |
| Moneyline Spread Total Team Total + 8 competitions | Moneyline Spread Total Team Total + 9 competitions | Moneyline Spread Total Team Total + 35 competitions | Moneyline Spread Total Team Total + 227 competitions |
| Hockey | Soccer | Tennis | Volleyball |
| Moneyline Spread Total Team Total + 46 competitions | Moneyline Spread Total Team Total + 287 competitions | Moneyline Spread Total + 758 competitions | Moneyline Spread Total + 70 competitions |
It includes the major and minor competitions for each sport.
Pinnacle Odds Used
The B2I Strategy Builder uses Pinnacle opening odds to find qualifying selections and it uses Pinnacle closing odds to calculate the profit and loss of a strategy.
Public Strategies shared by B2I and Other Users
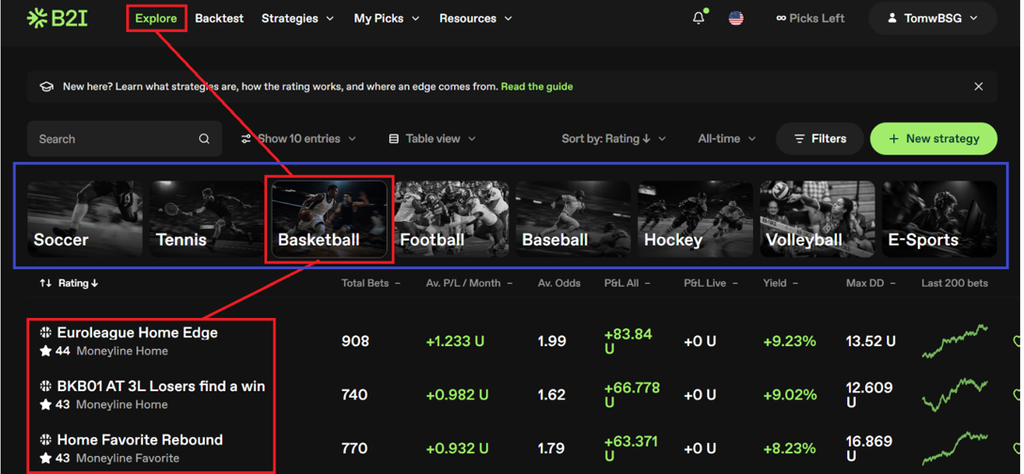
When you first enter the tool and click on the “Explore” screen, then you can see clickable images of the eight sports. If you click on one, then you will see a list of public strategies that, by clicking on a column header, you can sort by Rating (0-100), Total Bets, Average Monthly Profit, Total Profit, Live Profit and Loss, Yield and Maximum Drawdown.
You can also see, but not rank by, Average odds and Last 200 Bets chart.
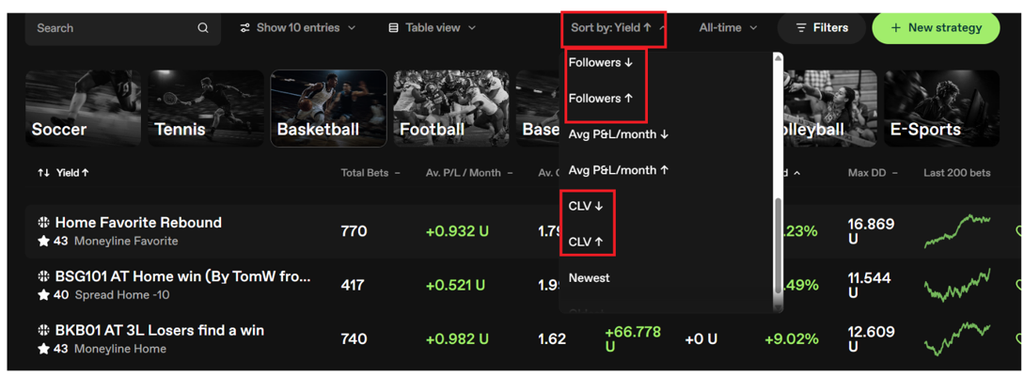
There are also additional filter options to rank by Number of Followers and CLV (Closing Line Value).
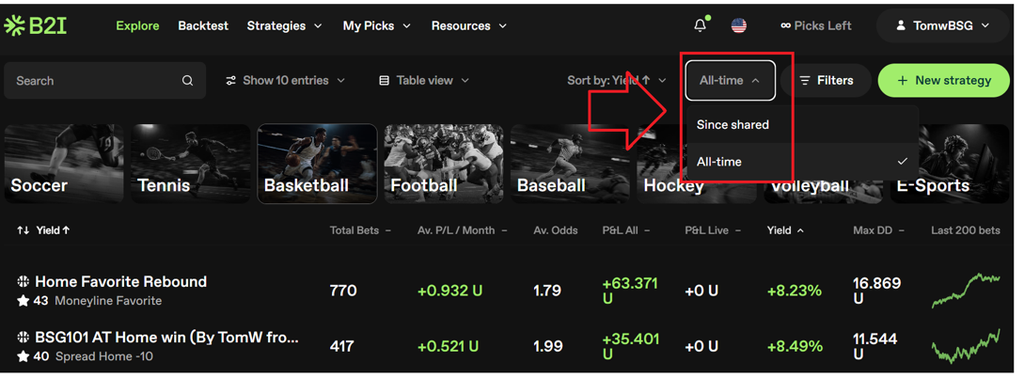
You can also view the strategies by “All time” or “Since shared” results.
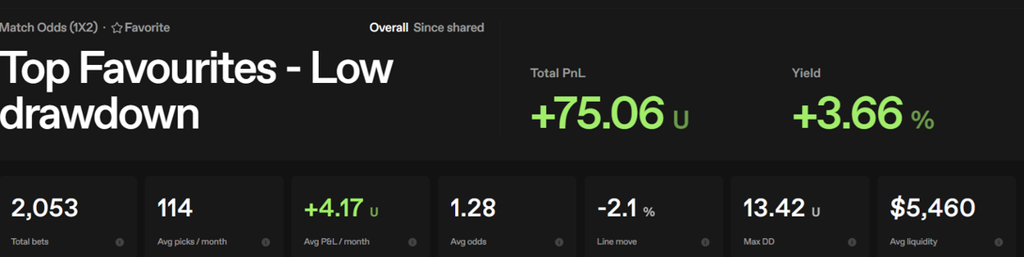
If we click on the name of strategy, then we can see its key data and its profit chart.
On the profit chart, we can see a “Since shared” dotted line. This is the Since Shared date. All data before that was used in the Research Period. All data after the line is new data from live bets. If we hover the mouse over the profit line, it will tell us the precise date of the start of this strategy. In the case below, March 30th 2025.
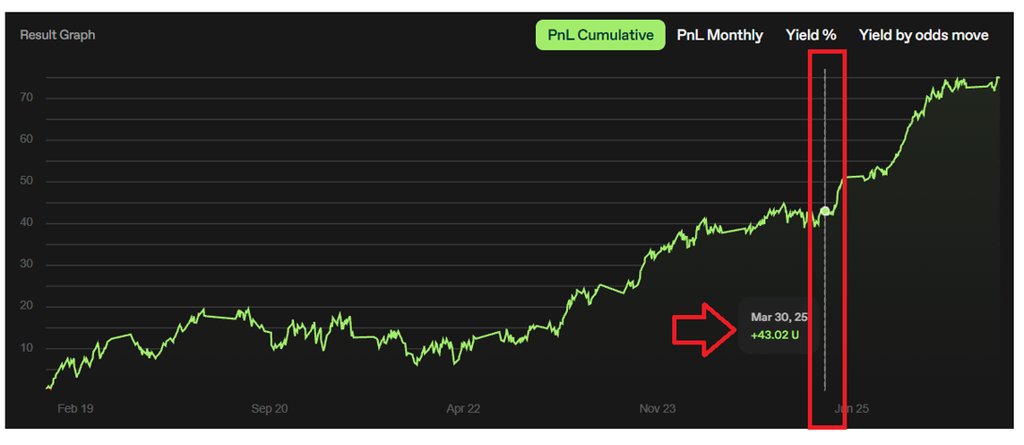
B2I was officially launched on September 1st 2026, but it was in development for many months before that, and the B2I team have been using some strategies based on backtested data since January 2025. This means that you may see some strategies that have Since Shared dates that pre-date the public release of the tool.
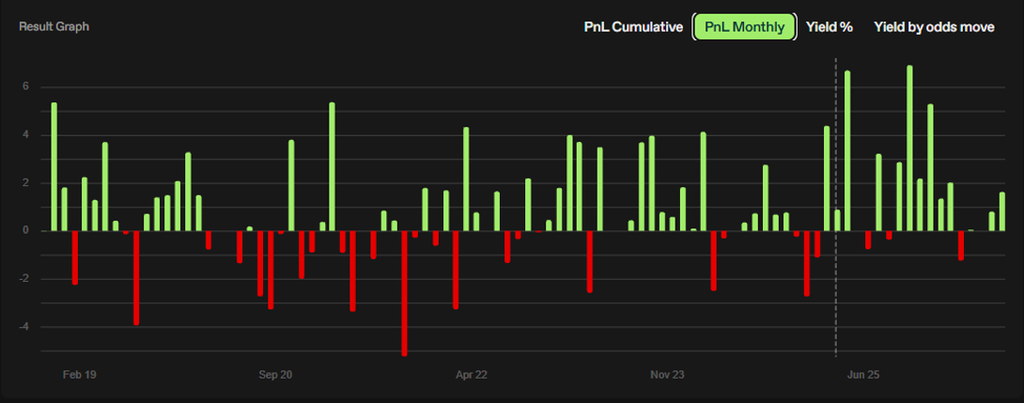
There is also a Monthly View for the Profit and Loss
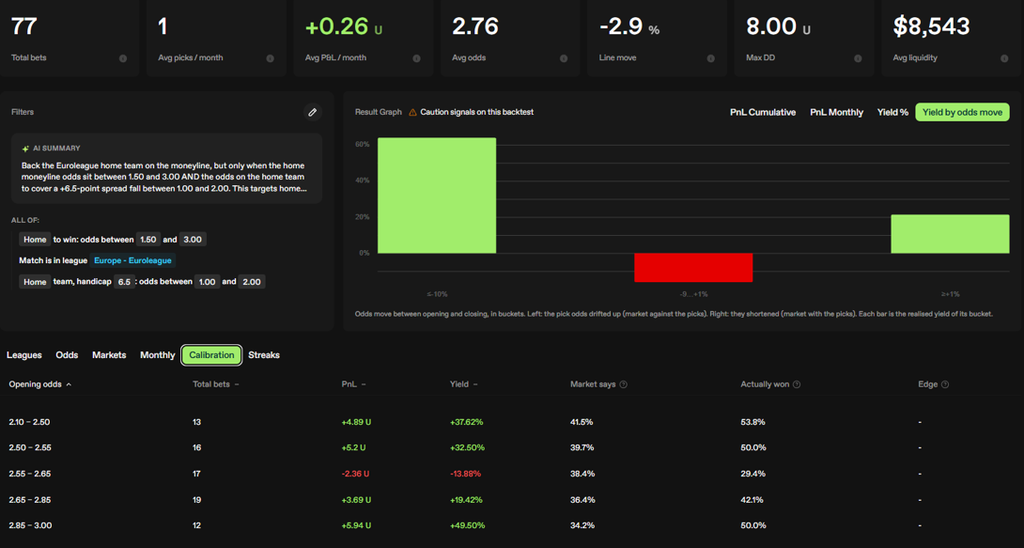
And there is a Yield by odds move chart that shows data about the price change of the opening to closing odds for each odds band.
This is a very interesting chart because on the left it shows us the yield (ROI) of picks whose closing odds were higher compared to their opening odds. In other words, the market was against this selection and the odds drifted higher. On the right are the yield (ROI) of picks whose closing odds were lower compared to their opening odds. In other words, the market was for this selection and the odds shortened lower.
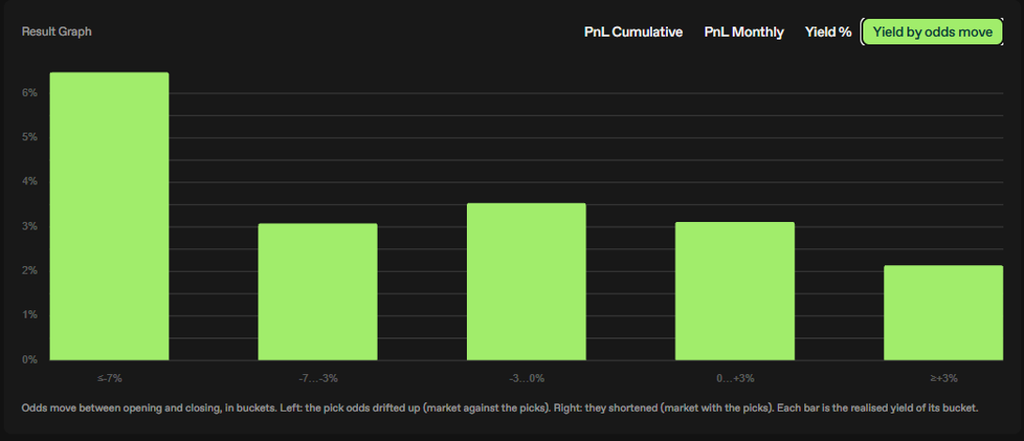
From this we can see that more yield was made on picks whose odds rose after the opening odds came out. If we hover the mouse over the bar, we can see the bet numbers, too. If the bet numbers are low, then it could just be random statistical noise, but if the bet numbers are high, then it gives more evidence to believe that statistic.
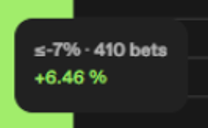
For this figure, when it says
<-7%
410 bets
+6.48%
It means that the odds for picks with opening odds in this range drifted by an average of more than 7%.
For example, if the average opening odds were 2.00, then the average closing odds were 2.14.
(2.00 x 1.07 = 2.14)
This also opens up possible trading opportunities if you know that picks with opening odds in that odds range are more likely to rise in value, meaning you could lay the selection 48 hours before event start and then trade out 1 minute before event start.
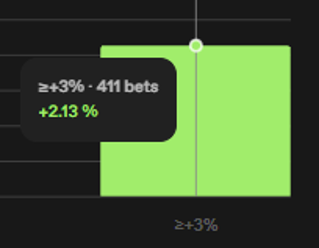
In the screenshot below, we can see that there were 411 bets of data used for this statistic.
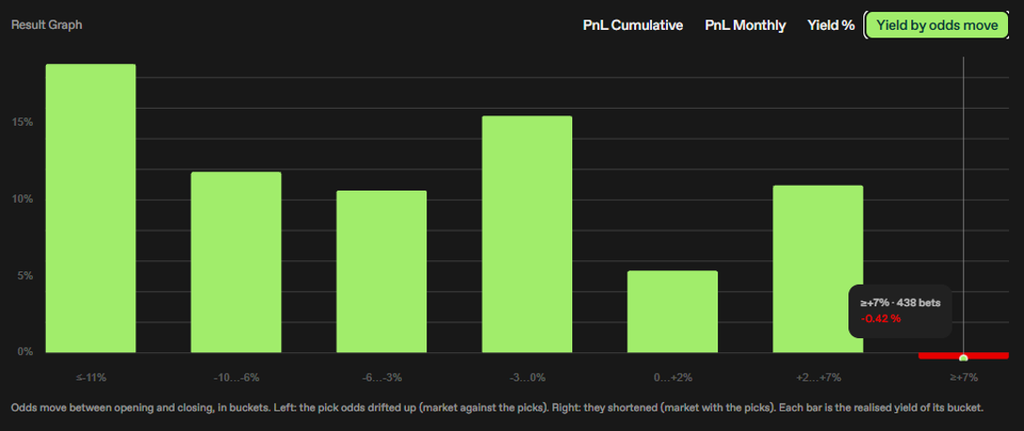
When I ran my mouse over the five columns, they all had 410 or 411 bets. So I think the site automatically splits the charts up into equal bet volumes. That’s good.
I checked another chart, and that had 7 columns, each with 438 bets exactly. So it seems to be breaking up the data into useful chunks of 400-ish bets.
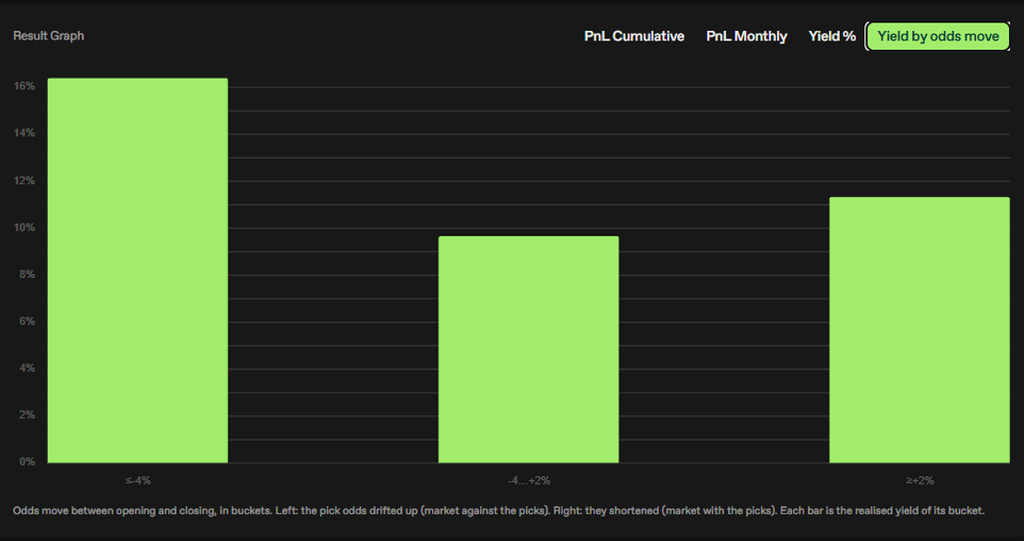
For a strategy with 1,000 bets, it split it into just three columns.
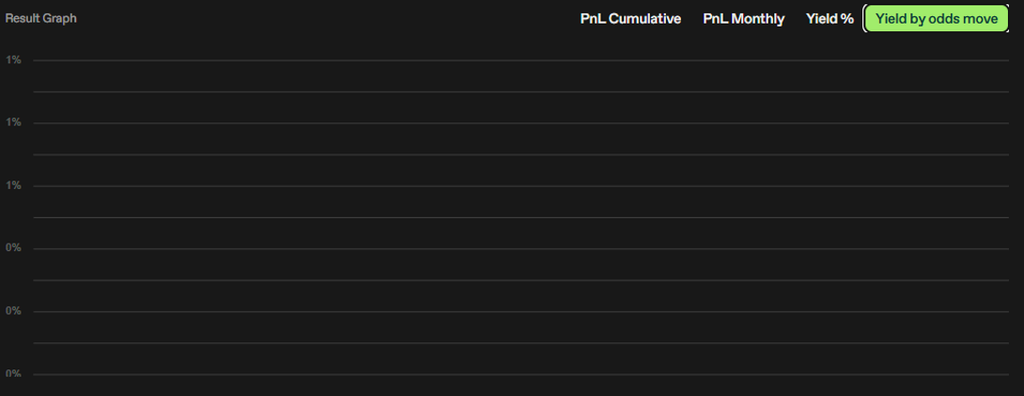
And for a strategy with 400 bets, it did not even display anything since it would be misleading to show the data with too little a sample to mean anything. Interesting!
The important thing to understand here is that if a column on one of these charts is red, then it means you should not bet on these picks if they decrease in value by that column’s amount. This is useful stuff. So some strategies can make a profit even if the prices shorten, but some strategies have a minimum odds level where we should not bet lower.
You can also see the historical data broken down by competition.
This includes a useful “Line Move” column that tells you if the odds usually shorten or lengthen before event start for this competition. This can tell you if it is better to bet early, or to bet late on the picks. It compares the opening price to the closing price. If prices usually shorten, then bet early. If prices usually lengthen, then bet late.
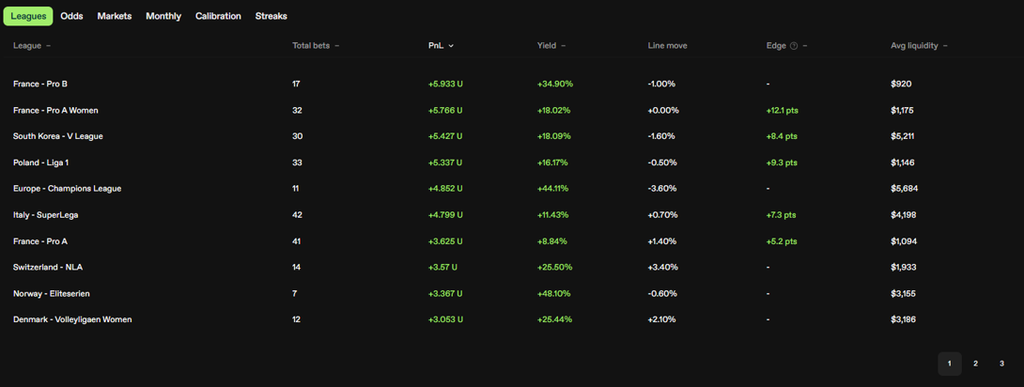
There is also an “Edge” column that is different from the yield column. This does not simply tell you your ROI, but it tells you the gap between how often these bets actually won and how often the market’s odds implied they would win.
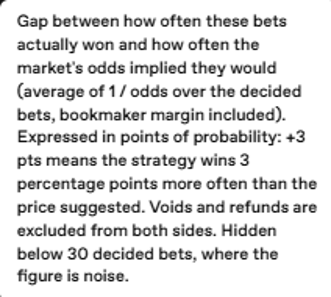
The odds view breaks down the results by odds bands to help you see where the trend is strongest.
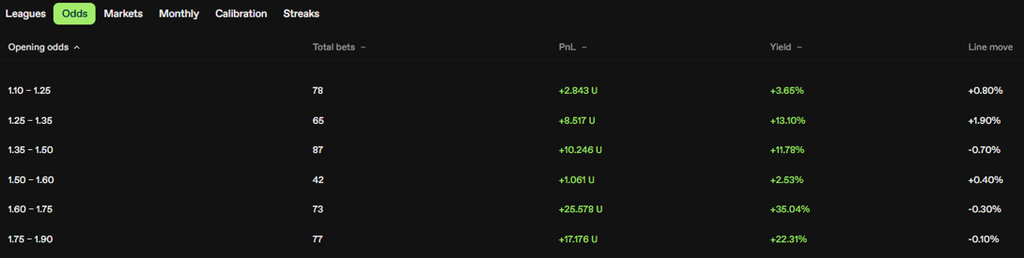
The monthly view shows how many bets and the results from the previous months.
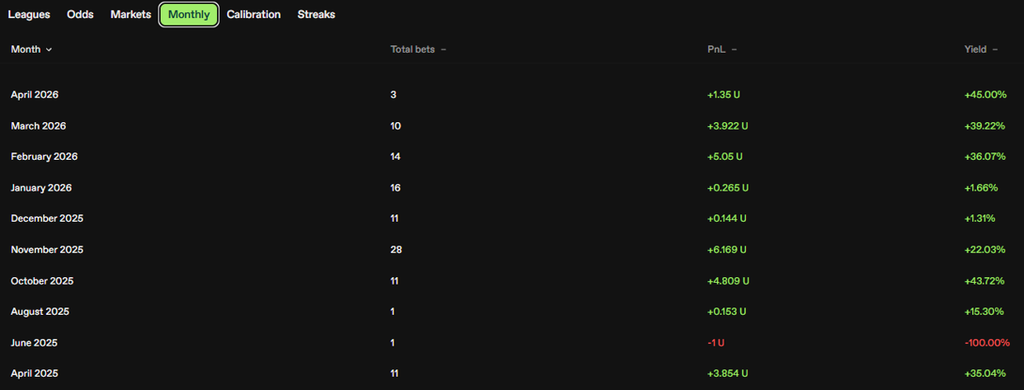
The Calibration view gives you more details about the edge.
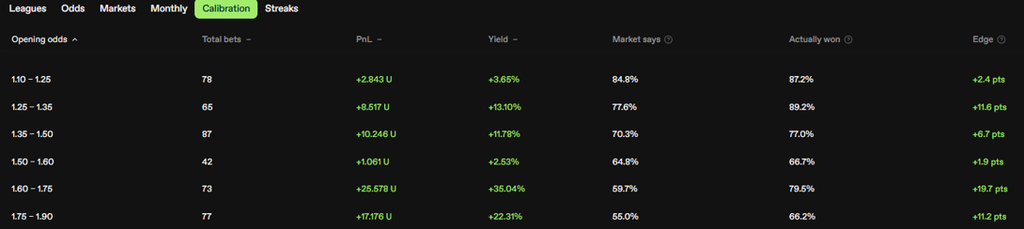
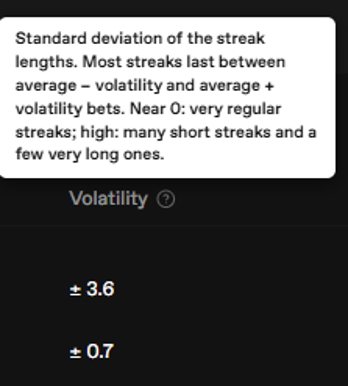
The Streaks view shows the win/lose longest streak, average streak and volatility.

Hovering over “?” marks give details on those statistics such as the Volatility statistic.
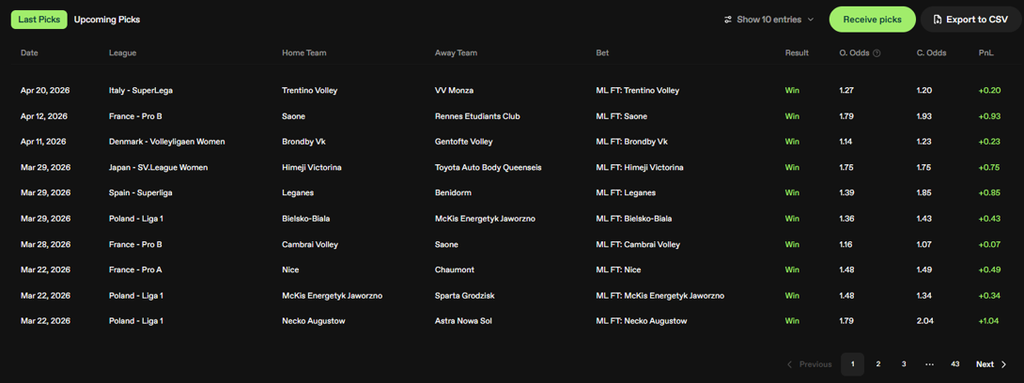
Then at the bottom of the strategy screen it shows the Last Picks of the strategy to give you an idea of what kind of bets this strategy makes. If you have are subscribed to receive picks for this strategy, then you can also see the Upcoming Picks, too.
Following Strategies
If you like the look of a strategy, then you can choose to “Receive picks” for that strategy via email or Telegram message. (They are working on it making it send to phones, too.)
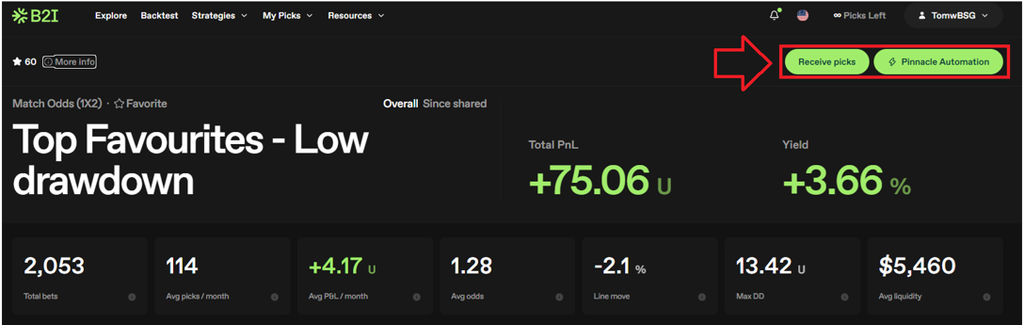
You can also choose when to receive those picks using a slider with the options of:
| As soon as the pick is detected | 24h before the cut-off time | 12h before the cut-off |
| 6h before the cut-off | 3h before the cut-off | 1h before the cut-off |
| 30m before the cut-off | 15m before the cut-off | 5m before the cut-off |
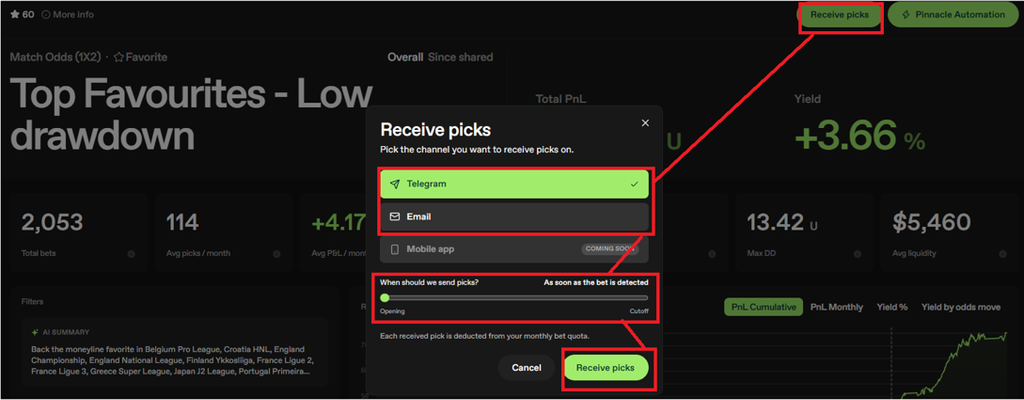
If you have an active subscription, then you can choose to receive picks.
After you click to receive a pick, one credit is deducted from your pick balance.
You get a monthly allowance of picks, depending on your subscription.
If you renew your subscription, then unused picks get carried over to the next month.
The subscriptions are auto-renewed, so you don’t have to actively remember each time.
If you want to cancel the subscription, there is a cancel button inside your account profile.
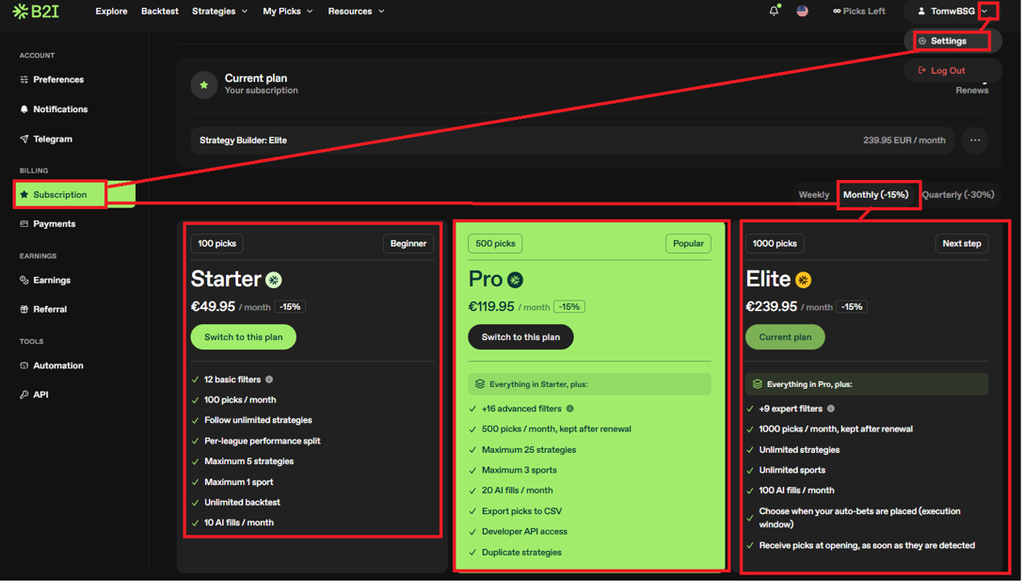
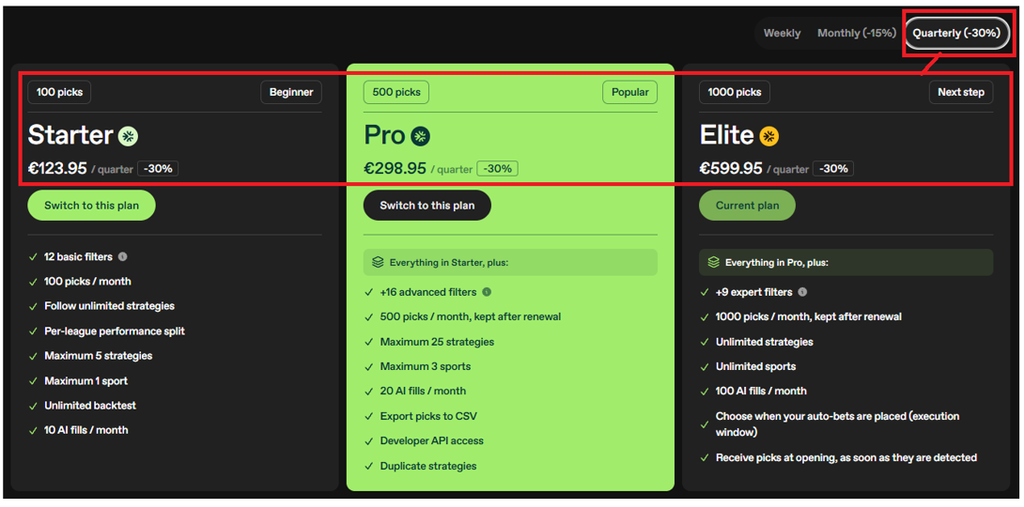
You can maximise your discount to 30% by paying quarterly for a 3-month pack in one go.
I recommend the Elite plan to get 1,000 picks per month and be able to enable unlimited strategies, access all eight sports, use all the strategy filters and get flexibility on choosing when your bot bets on the picks.
Manual Betting
If you don’t have a Pinnacle.com account, you can receive the picks via email or Telegram or export them as a CSV file*. (*with Pro or Elite plans) And then you can bet manually on the picks.
Picks can be sent out very early, giving you plenty of time to get your bets on.
Automated Betting
If you have a Pinnacle.com account, you can automate betting on these strategies through there.
Again, you can choose when to receive the pick and place the bet.
The automation fee is 0.2% of the stake placed on that bet.

This fee is deducted from your B2I balance, not from your Pinnacle balance, so you will need to deposit and keep that topped up in the B2I tool in the Payments area of your account. There is also a handy auto-recharge setting so that you never miss an automated bet.
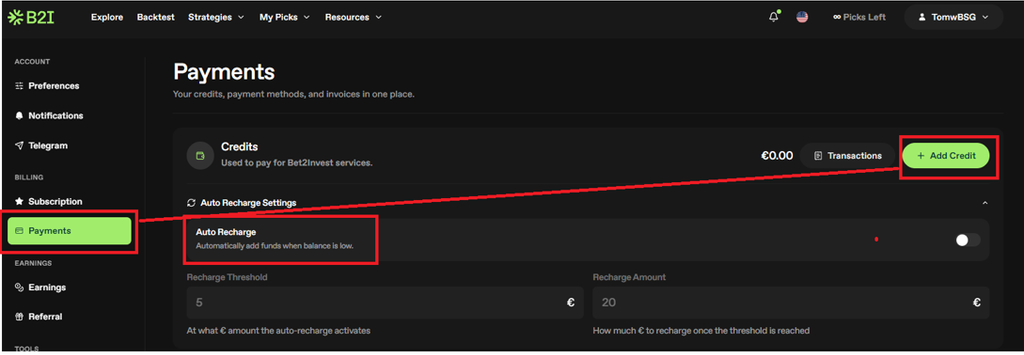
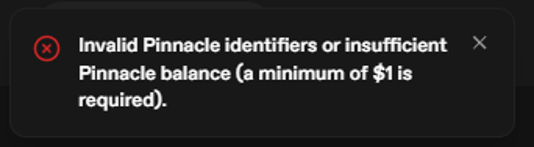
When connecting your Pinnacle account, you will need to have a balance of 1$ equivalent or more to complete the connection.
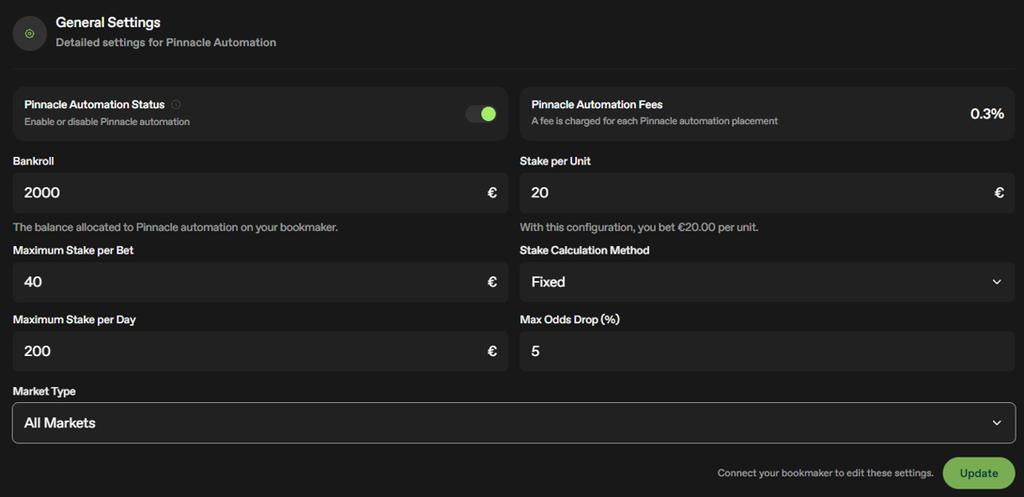
In the General automation settings, you can choose Level Stakes or Percentage Staking.
Pinnacle Automated Bot Settings
For Level Stakes, you set your stake per unit.
For Percentage stakes, you set your Bankroll, and then a percentage between 0.5% to 10%.
You can set Maximum Stake per Day, which means putting a limit on the maximum total amount of money that can be bet in a day.
You can also set a Maximum Odds Drop from the Opening Odds.
It is also possible to limit betting to only certain markets if needed.
Strategy Filters, Duplicating Strategies and Researching your own Strategies
In each of the strategies, you can see the settings if you have an active subscription. (Some shared strategies have their settings hidden by the owner, but at the moment, most seem to be visible.)
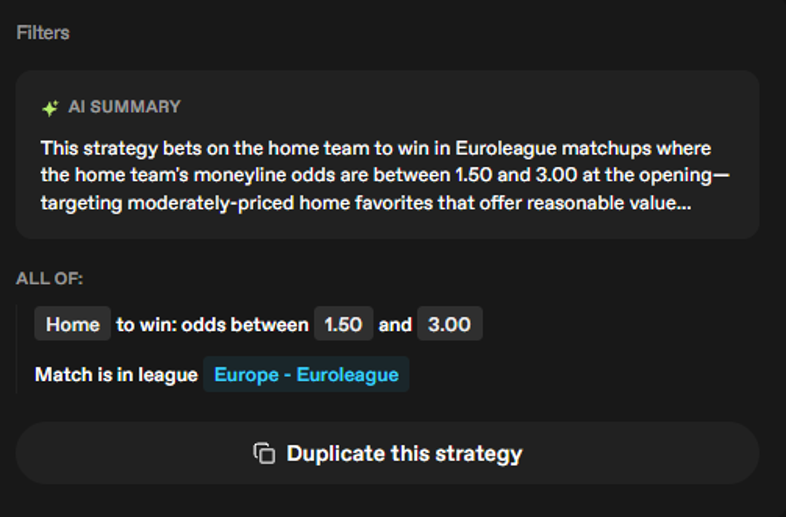
There is an automatically generated AI summary of what the strategy does.
American Odds / Decimal Odds
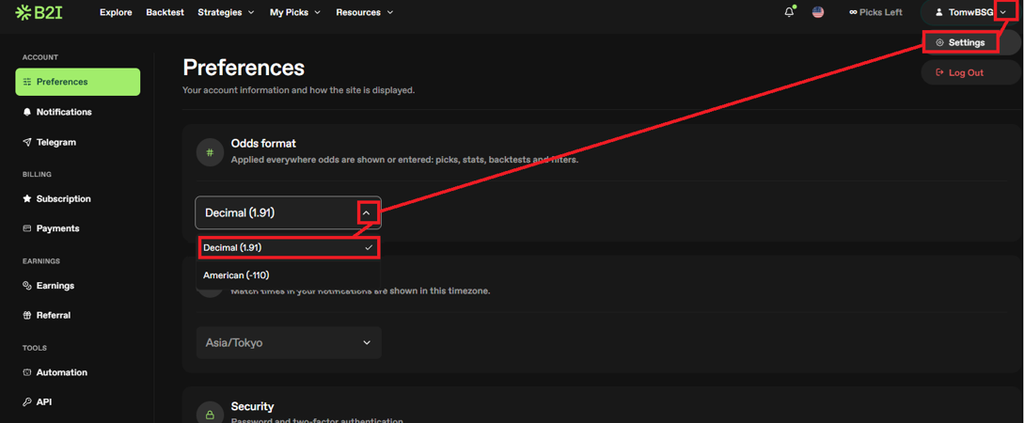
If your screens shows American odds and you want to change to decimal odds, then go to your Profile > Settings and change the Odds Format there.
You can duplicate and edit a strategy by clicking the “Duplicate strategy” button.
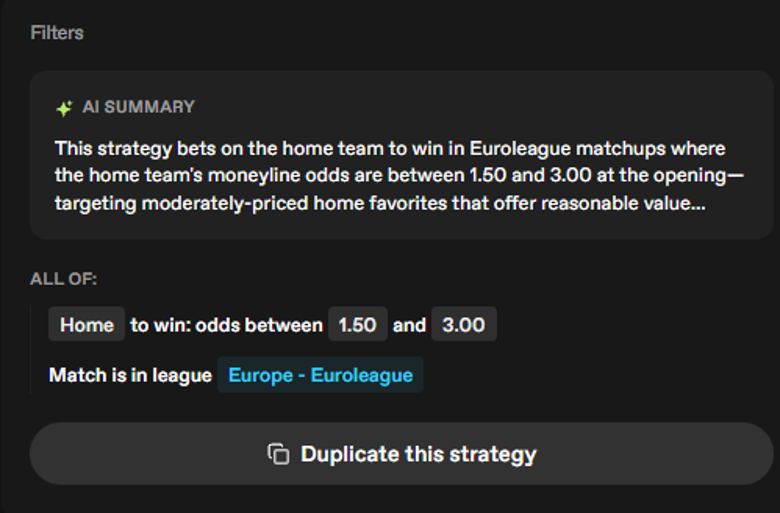
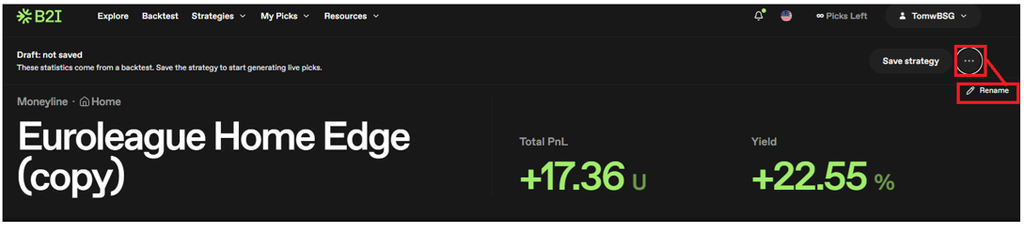
It will automatically give it the previous strategy name with the words (copy) in brackets at the end of it. You can then click on the “Edit” icon to edit the filters.
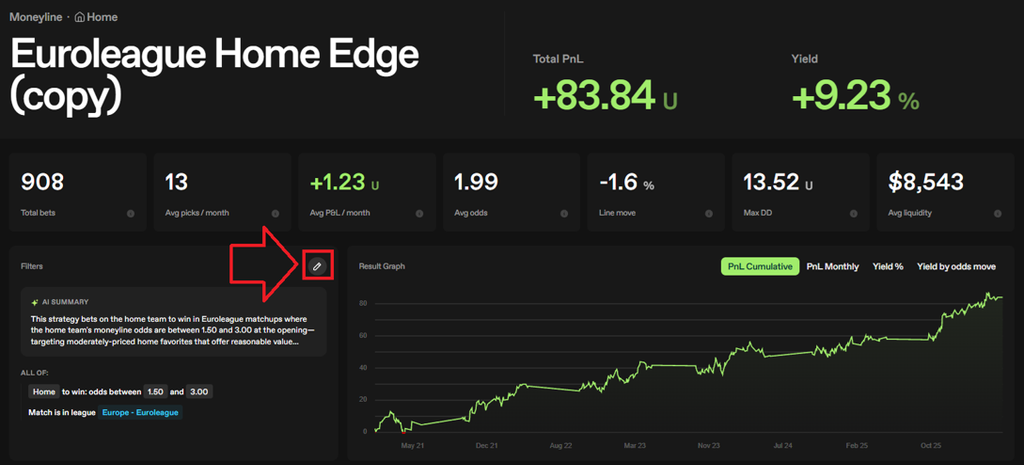
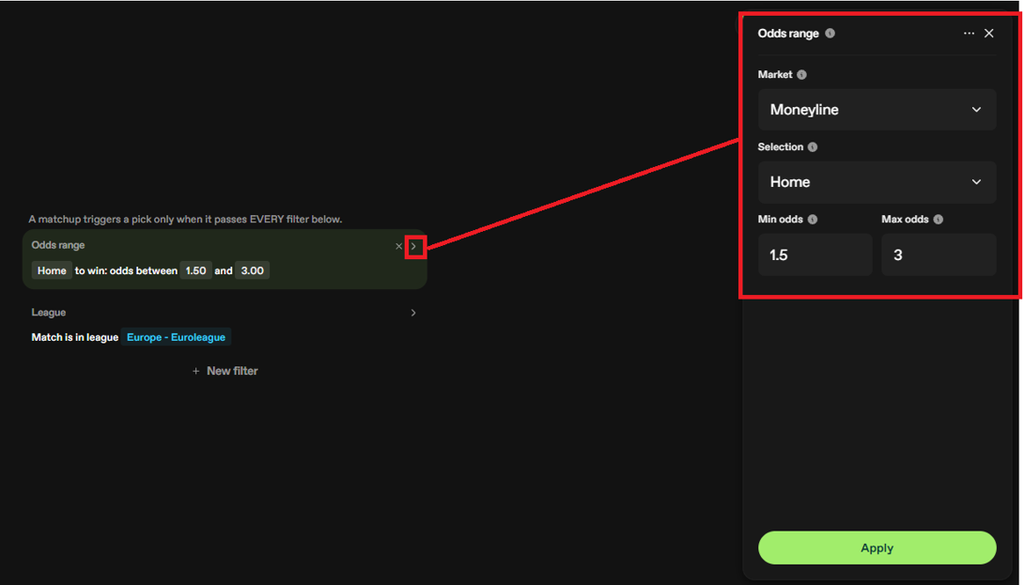
You can edit a filter by clicking on the small “>” icon to open up the filter tab on the right.
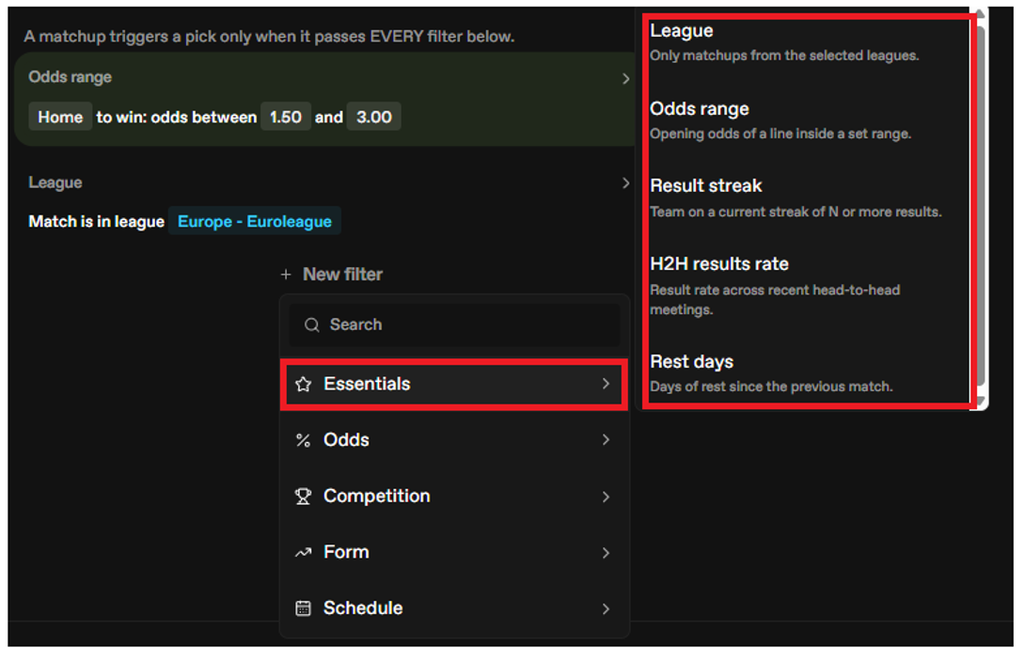
You can click on “New filter” to add a variety of settings.
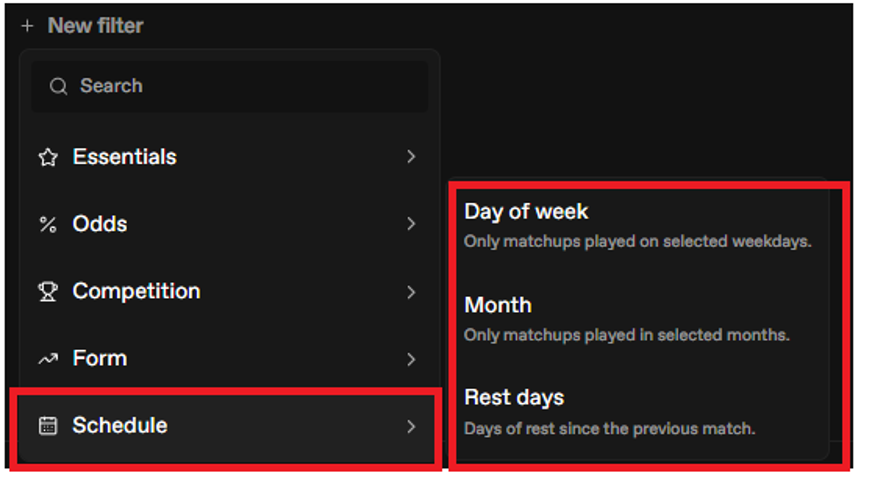
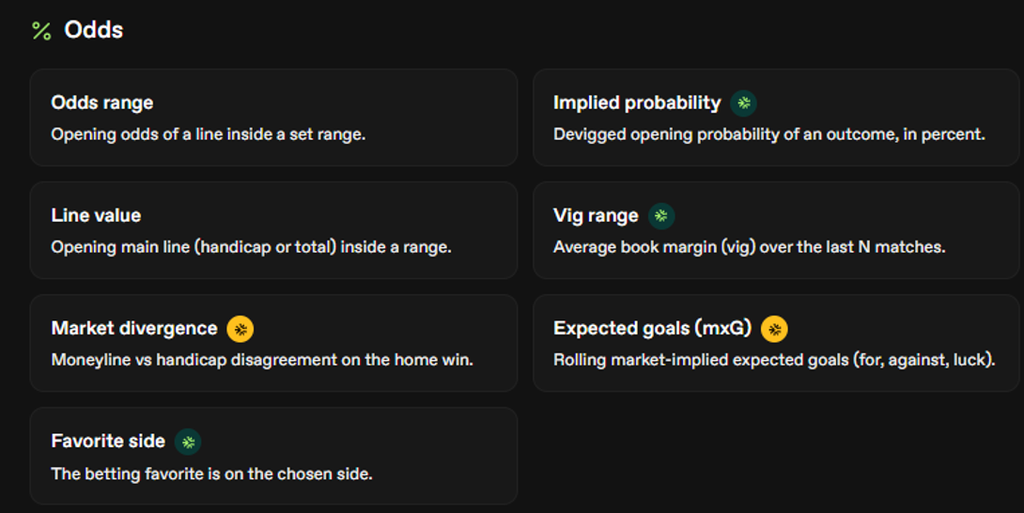
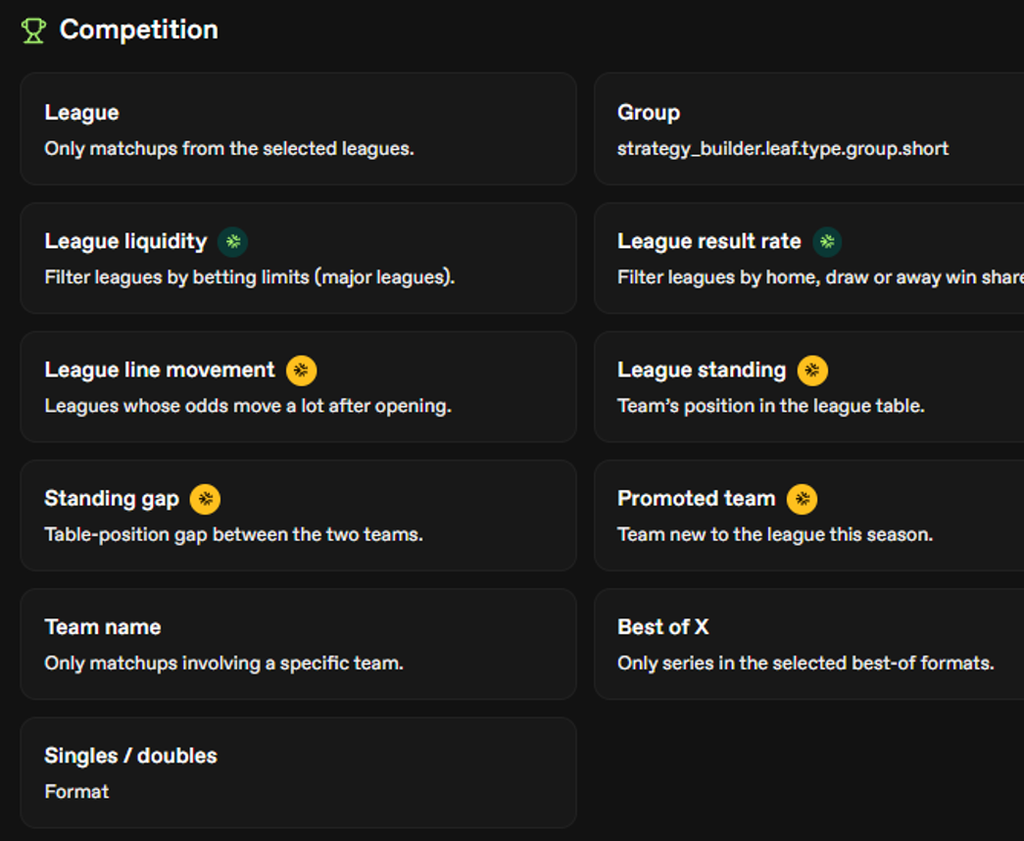
There are five categories of filters: Essentials, Odds, Competition, Form, Schedule.
Essentials Filters
Odds Filters
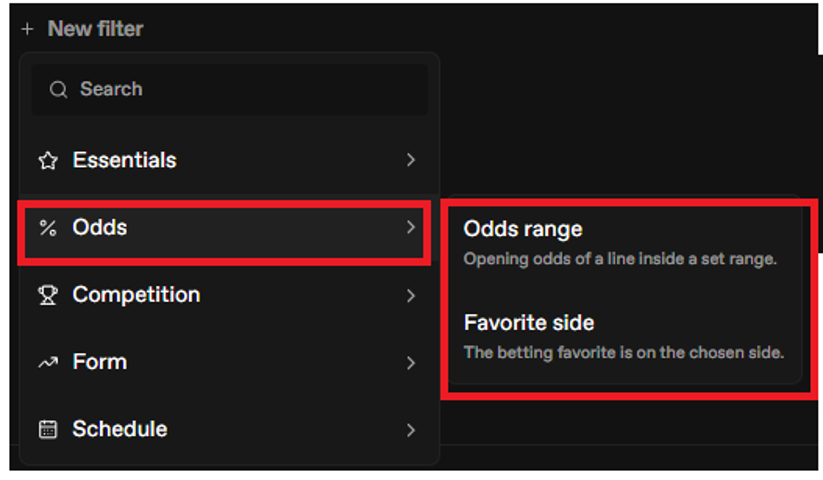
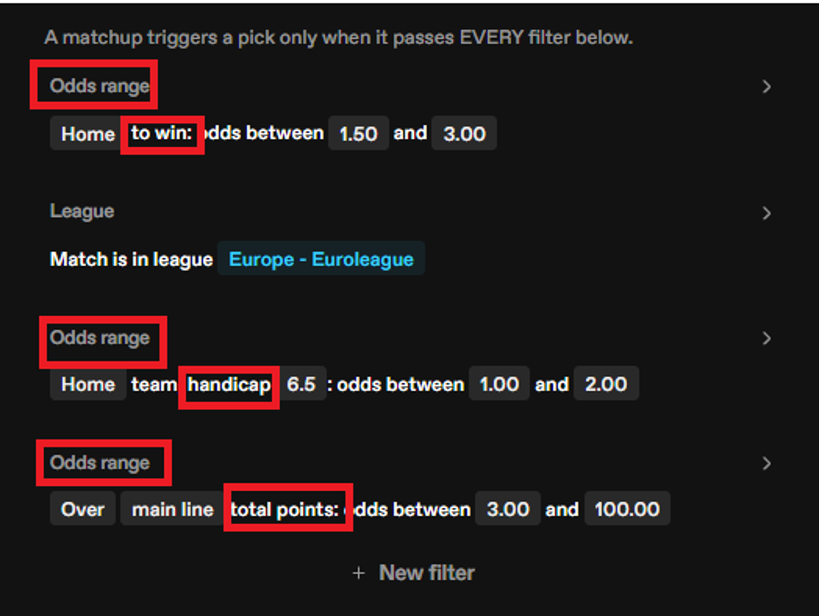
With the odds range filters it is possible to have multiple odds filters that look at different markets.
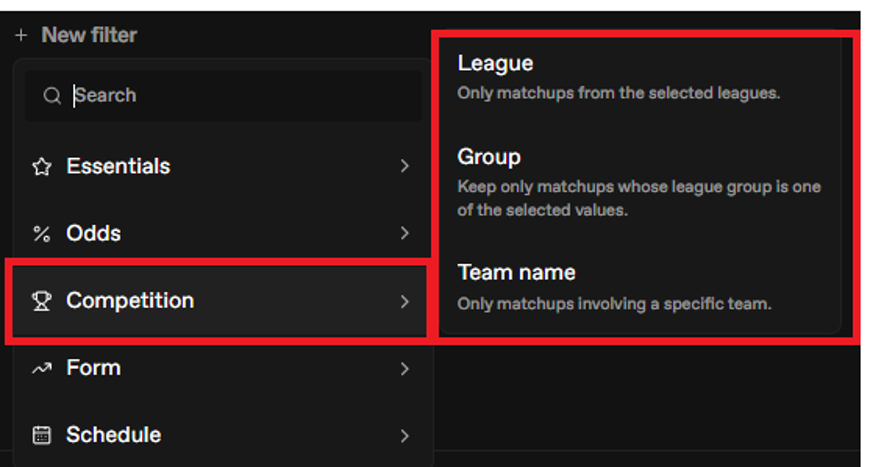
Competition Filters
Note that “Group” is a country or region filter.
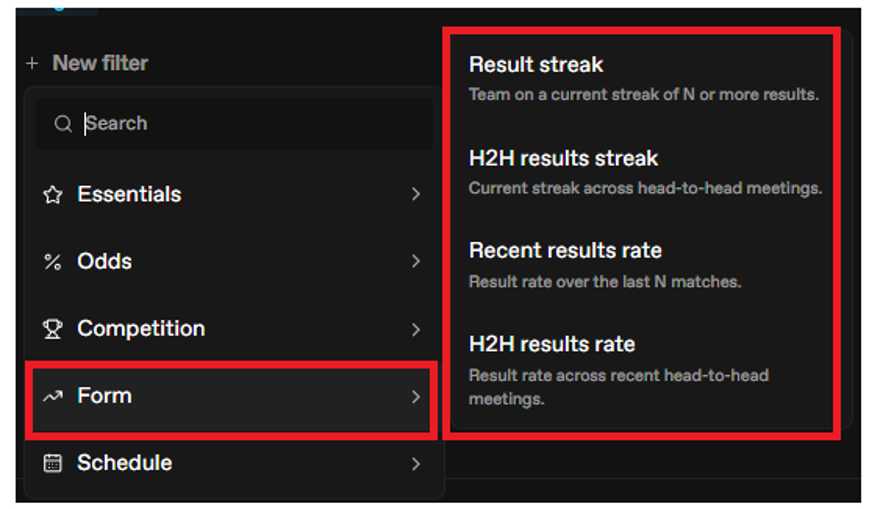
Form Filters
Schedule Filters
The Schedule filter includes a day of the week filter for those people who want to test if some days work better than others.
What exact filters are there for each subscription level?
There are 37 filters.
If there is no icon next to the filter, then all three subscription packs, Starter, Pro and Elite, have them.
When there is the Pro icon, it means only Pro and Elite packs have this filter.
When there is the Elite icon, it means only Elite packs have this filter.
The filters can be seen here: https://strategies.bet2invest.com/en-us/filters
If you click on each filter, it explains more about how to use it, and offers templates that go with it.
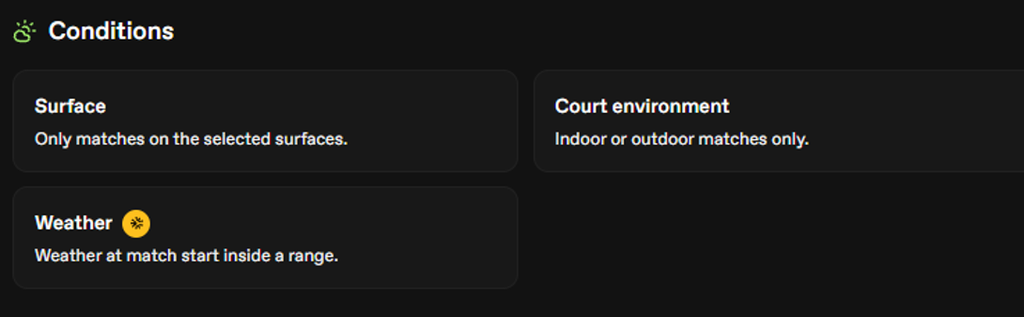
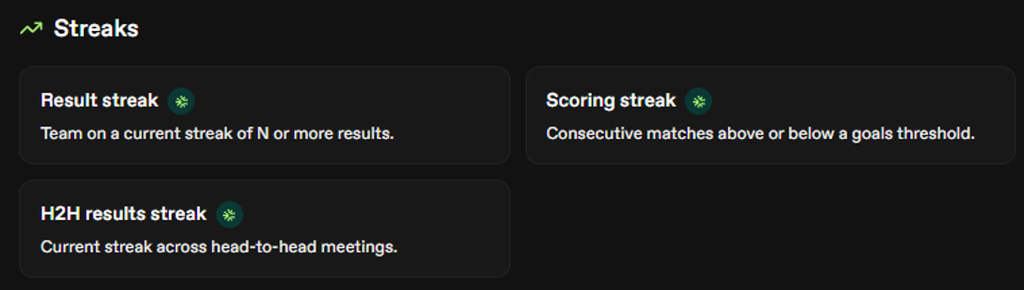
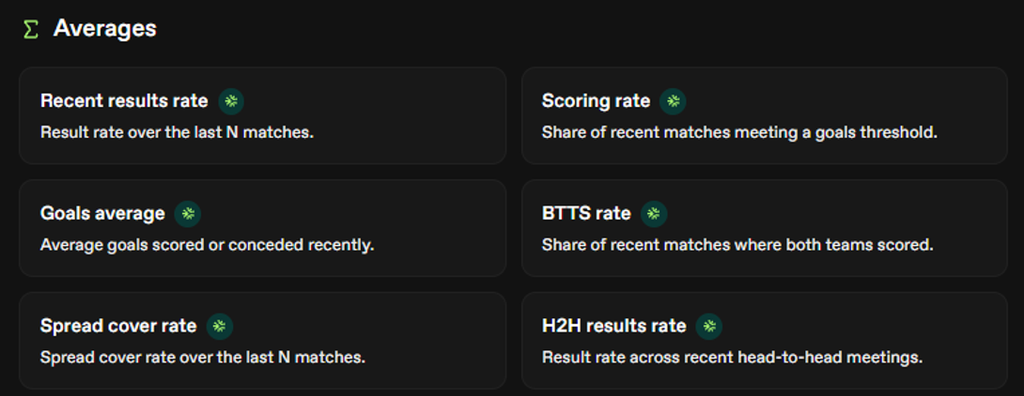
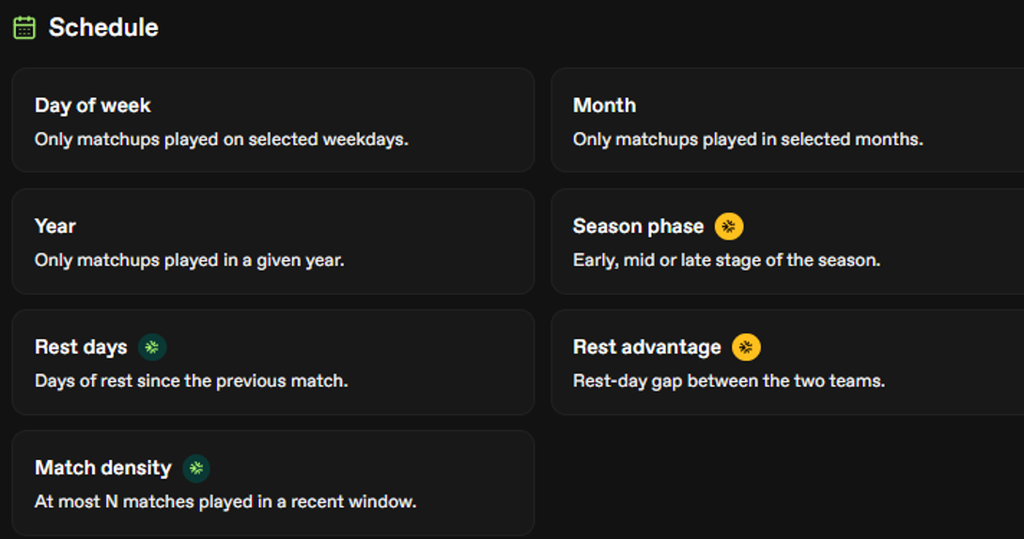
Each time you add or change a filter, the bottom left key statistics will automatically re-calculate.
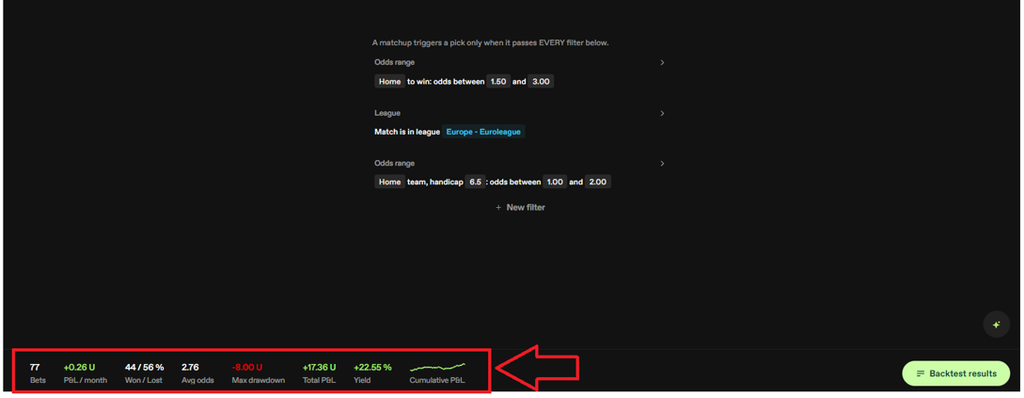
If you want to see more details of graphs, leagues and other data, then click on the bottom right “Backtest results” button.
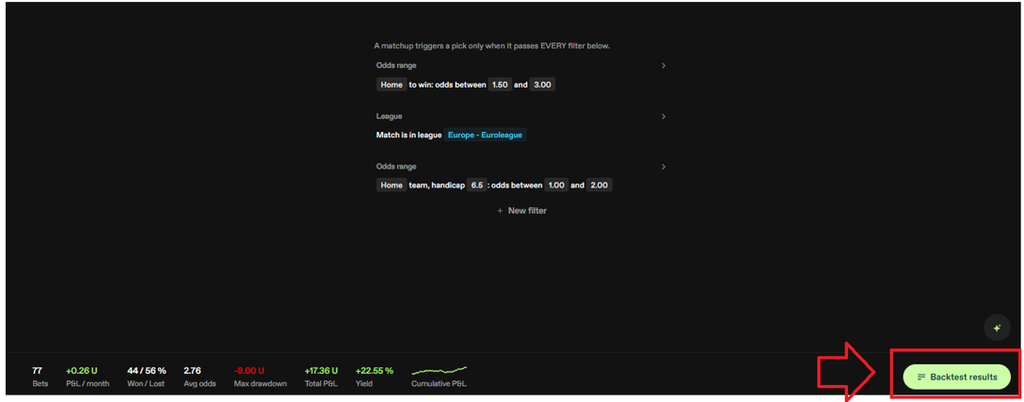
Then we can see the graph and tables for statistics such as the “Yield by odds move” bar chart or the yields for different odds ranges table.
If you like the strategy, you can save it with the button at top right.
You can change the name by hovering over the three dots next to the Save Strategy button.
Enable/Disable
When a strategy is saved, it is automatically “Enabled” by default meaning that it will actively gather new live data to populate the “Since shared” time period.
The number of “enabled” strategies you can have in your private “My Strategies” area depends on your subscription plan.
Elite plans have no limit.
Pro plans have a limit of 25 “enabled” strategies in your private “My Strategies” area.
Starter plans have a limit of 5 “enabled” strategies in your private “My Strategies” area.
This only matters if you are duplicating, researching and creating your own strategies.
All plans allow following of an unlimited number of public strategies.

Ways to get around this limit on Starter and Pro Plans
If you disable a strategy, you can keep it in your My Strategies area, but it just won’t gather new live data.
If you share a strategy to the public strategies area, then it will always be enabled there and gather new live data, and you can disable it in your My Strategies area to fill up a slot for another strategy to be enabled.
Elite plans have no such limits of course.
Rating
Once saved, you can see a rating at the top left. Click on the star to see an analysis of the strategy.
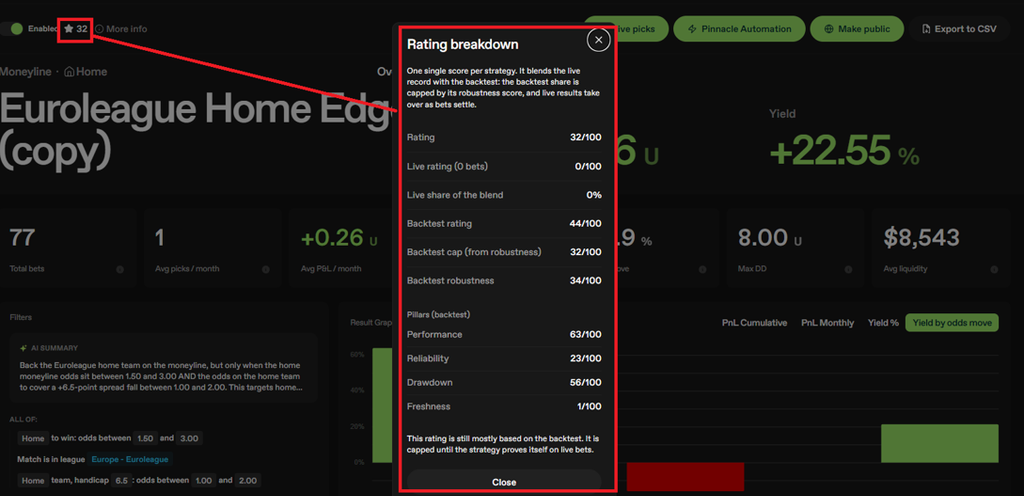
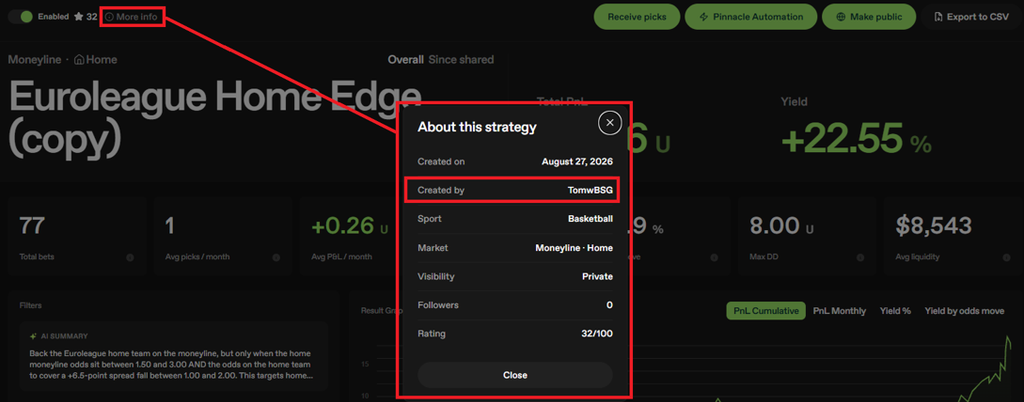
If you click on “More info” then you can see details like when this strategy was created, who created it, the sport, the market, public/private, number of followers and the rating.
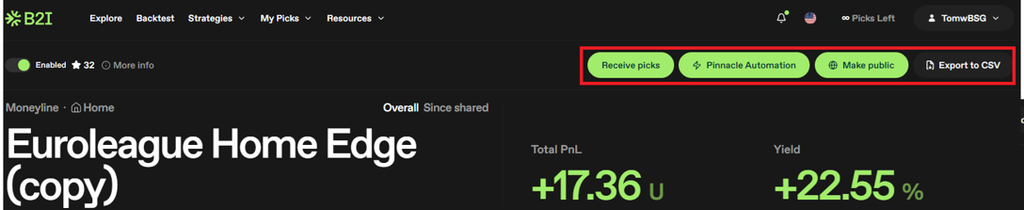
You can choose to Receive Picks, Enable Pinnacle Automation, Make the strategy public or Export the current and historical bets to CSV.
When you export to CSV, the file looks like this in Excel.
“Live” means a future pick that has not been settled yet.
“Simulated” means that the bet has been settled. It does not mean the bet was specifically a backtested bet from the Research Period or a bet from the Since Shared period.

The CSV column headers are
placedAt
source league
homeTeam
awayTeam
market
side
designation
points price
openingPrice
openingPoints
closingPrice
minPrice
outcome
profit
trigger
Creating your own strategies
You can also create your own strategies from scratch.
Click “Backtest” at the top and the choose the sport, market and bet type.
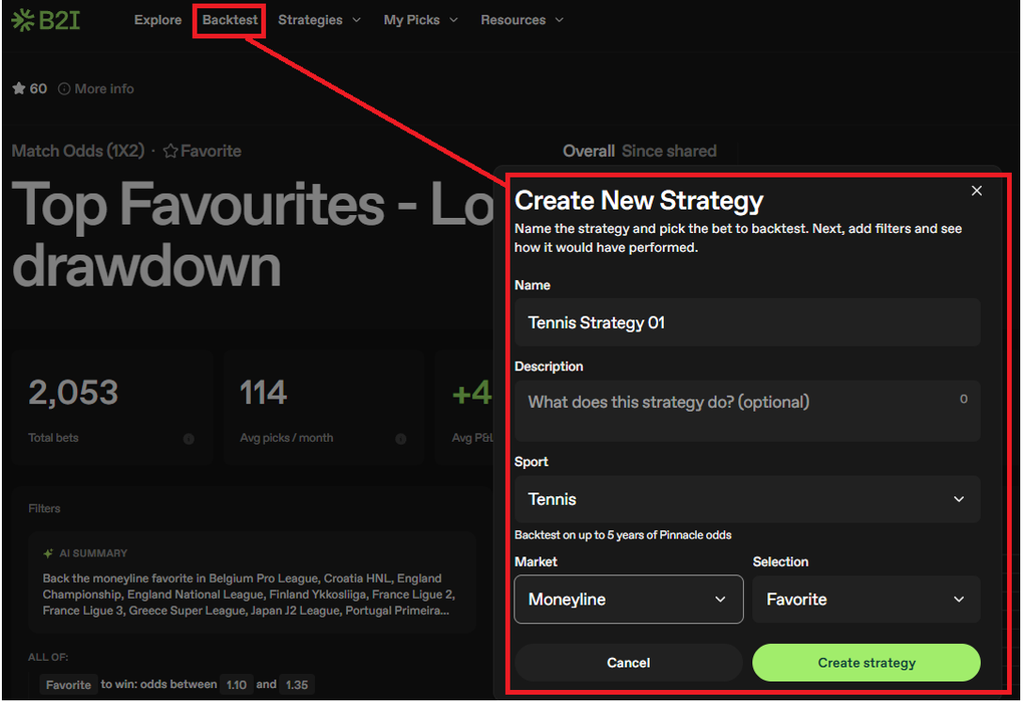
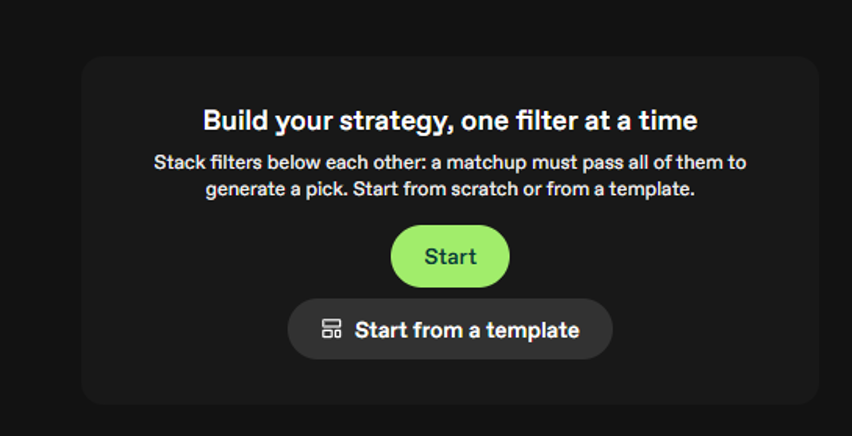
You then get the opportunity to start fresh or start from a template.
It then gives you different categories of templates. Each sport has different templates.
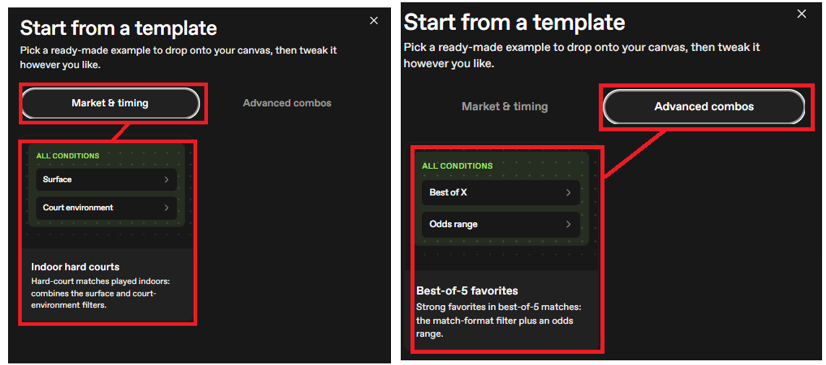
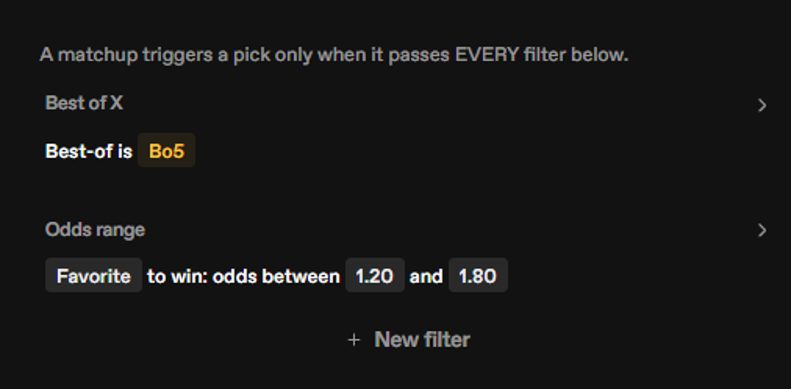
After you click on a template, it gives you a starting position.
You are then free to edit, add and remove filters.
And if you make a good strategy, you can consider sharing it publicly and earning a portion of subscriber revenue from it. You can keep your strategy settings visible or hidden when sharing strategies to the Public Strategies area.
Public Strategy Setting Visibility
Some public strategy settings are kept private by the user who shared them, but many of the public strategies have visible settings. Public strategies shared by users with private settings can still be followed. You just cannot see the settings. It is possible for users who share strategies to receive a percentage of the revenue generated by people who subscribe to those tips, including both manual and automated bettors. So, if you have a good strategy, you can share it and earn money on it without revealing the magic settings.
Share your Strategies and Earn Money!
How revenue share works
The full mechanics of creator revenue share: 20% of every subscriber’s plan, split between the public strategies they follow, prorated by delivered picks. You earn a share of every subscription your strategies serve
Bet2Invest strategies are free to follow. Instead of selling access, creators are paid through revenue share: 20% of every subscriber’s plan is set aside for the creators of the public strategies they follow. The better your strategy performs and the more bettors rely on it, the larger your share.
There is nothing to configure and nothing to price. Publish a strategy, deliver picks, get paid.
How the pool is split
Each month, every subscriber generates a creator pool worth 20% of their monthly plan price (excluding VAT). That pool is divided between the public strategies they follow, prorated by the number of picks each strategy actually delivered to them over the month.
A concrete example:
- A bettor pays €120/month (€100 excluding VAT). Their monthly creator pool is €20.
- They follow two public strategies. Over the month, strategy A delivers them 50 picks and strategy B delivers 50 picks.
- Each creator receives €10 from this subscriber.
If strategy A had delivered 75 picks and strategy B only 25, the split would be €15 and €5. Multiply that by every subscriber who follows your strategy: each of them contributes their own share of their own pool.
Two details worth knowing:
- Only delivered picks count: notifications that actually reached the subscriber within their plan quota.
- Following your own strategy earns nothing. The pool only rewards strategies built by others.
Who can earn
Three conditions, all of them simple:
- Your strategy is public. Private strategies serve only you. Publishing requires passing the quality criteria (minimum backtest size, activity, drawdown control), which protects subscribers and keeps the marketplace credible.
- You hold an active paid plan. Creators earn as long as they are themselves subscribed to Bet2Invest. If your plan lapses, your public strategy keeps running and keeps delivering picks to its followers; it simply stops accruing revenue for you until you subscribe again. Nothing is deleted, nothing is unpublished.
- You have completed your payout profile. Identity verification and payout details (see below).
When and how you are paid
Earnings are computed at the start of each month for the month that just ended. You can track everything in Settings, then Earnings: pending balance, amounts already paid out, a month-by-month history, and the performance of each of your strategies.
Before any payout, we need two things, both handled from the same Earnings page:
- Identity verification. A quick check powered by Stripe Identity: a photo of an ID document, verified in a few minutes. Your verified name and address are what we use for payouts, so there are no forms to fill.
- Payout details. Choose how you want to be paid: bank transfer (IBAN), crypto (USDC or USDT wallet address), or PayPal.
Creators from every country can participate, with the exception of countries under international sanctions.
Why this model
Selling strategy subscriptions one by one puts a paywall between your work and its audience, and forces bettors to gamble on a strategy before seeing it live. Revenue share aligns everyone instead: subscribers get full access to the public marketplace with a single plan, and creators are rewarded in proportion to the real, delivered value of their strategies, month after month.
The strategies that earn the most are the ones that stay active, keep delivering picks, and give bettors a reason to keep following. Build something that lasts.
Automate Betting on Tipster Tips for your Pinnacle.com account
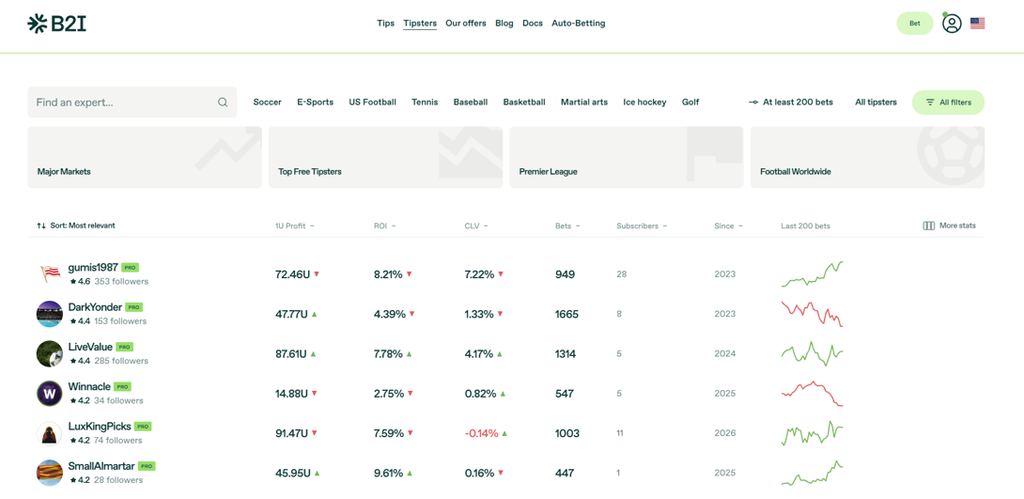
I should also mention that B2I’s main tipster website has the ability to follow free, paid and Pro tipsters and have those bets placed automatically on your Pinnacle.com account (or bet manually by receiving tip alerts). So you can follow backtested strategies and also tipster tips automatically on your Pinnacle.com account.
More Guides
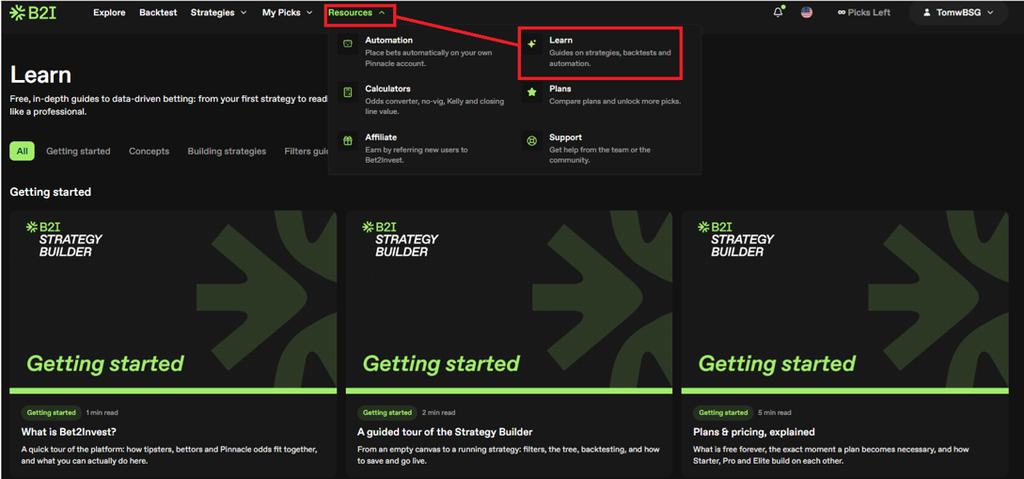
There are plenty of helpful resources to get you started.
This is a great new option for people wo want to automate their betting on Pinnacle or to research and backtest betting ideas on multiple sports.